Archive for the ‘Mercado’ Category

Con el rápido crecimiento de las fuentes renovables, el crecimiento en acceso a la electricidad; la electrificación de nuevos servicios en transportes, industria y construcciones; y la necesidad de construir una red inteligente, nuevas tecnologías para la transmisión de potencia sobre largas distancias y entre sistemas de potencia tienen la expectativa de crecer más allá de sus niveles actuales de implementación. La Figura muestra el histórico de crecimiento y la prospectiva hacia el año 2025 de las líneas de transmisión en HVDC.
Fuente: International Energy Agency. “Large-Scale Electricity Interconnecction: Technology and prospects for cross-regional networks”. IEA Publications http://www.iea.org. Paris, November 2016.
Dr. Jorge Luis Mírez Tarrillo
Group of Mathematical Modeling and Numerical Simulation (GMMNS).
Universidad Nacional de Ingeniería. Lima, Perú.
E-mail: jmirez@uni.edu.pe
Website Personal: https://jorgemirez2002.wixsite.com/jorgemirez
Facebook http://www.facebook.com/jorgemirezperu
Linkedin https://www.linkedin.com/in/jorge-luis-mirez-tarrillo-94918423/
Scopus ID: https://www.scopus.com/authid/detail.uri?authorId=56488109800
Google Scholar: https://scholar.google.com/citations?user=_dSpp4YAAAAJ
MATLAB Group Admin in Facebook: https://www.facebook.com/groups/Matlab.Simulink.for.All
WhatsApp Channel/Canal: https://whatsapp.com/channel/0029VbCvpZsAYlUSz2esek2y

Las inversiones en transmisión y distribución ha ido incrementándose como se puede ver en la Figura y se prevé con un horizonte de tiempo al 2025 que el mayor incremento se dé en la redes de distribución.
Fuente: International Energy Agency. “Large-Scale Electricity Interconnecction: Technology and prospects for cross-regional networks”. IEA Publications http://www.iea.org. Paris, November 2016.
Dr. Jorge Luis Mírez Tarrillo
Group of Mathematical Modeling and Numerical Simulation (GMMNS).
Universidad Nacional de Ingeniería. Lima, Perú.
E-mail: jmirez@uni.edu.pe
Website Personal: https://jorgemirez2002.wixsite.com/jorgemirez
Facebook http://www.facebook.com/jorgemirezperu
Linkedin https://www.linkedin.com/in/jorge-luis-mirez-tarrillo-94918423/
Scopus ID: https://www.scopus.com/authid/detail.uri?authorId=56488109800
Google Scholar: https://scholar.google.com/citations?user=_dSpp4YAAAAJ
MATLAB Group Admin in Facebook: https://www.facebook.com/groups/Matlab.Simulink.for.All
WhatsApp Channel/Canal: https://whatsapp.com/channel/0029VbCvpZsAYlUSz2esek2y

En la Figura se muestra la evolución de las emisiones de CO2 por sector. Los sectores que más contribuyen son la generación de electricidad y calor y el transporte. El sector residencial ha ido disminuyendo entre 1990 y 2014, mientras que el sector manufactura, industria y construcción tiene un comportamiento conservador.
Fuente: International Energy Agency. “CO2 Emissions from Fuel Combustion: Highlights”. IEA Publications http://www.iea.org. Paris, October 2016.
Dr. Jorge Luis Mírez Tarrillo
Group of Mathematical Modeling and Numerical Simulation (GMMNS).
Universidad Nacional de Ingeniería. Lima, Perú.
E-mail: jmirez@uni.edu.pe
Website Personal: https://jorgemirez2002.wixsite.com/jorgemirez
Facebook http://www.facebook.com/jorgemirezperu
Linkedin https://www.linkedin.com/in/jorge-luis-mirez-tarrillo-94918423/
Scopus ID: https://www.scopus.com/authid/detail.uri?authorId=56488109800
Google Scholar: https://scholar.google.com/citations?user=_dSpp4YAAAAJ
MATLAB Group Admin in Facebook: https://www.facebook.com/groups/Matlab.Simulink.for.All
WhatsApp Channel/Canal: https://whatsapp.com/channel/0029VbCvpZsAYlUSz2esek2y


Enlace del libro (información, precio, compra): https://www.morebooks.de/store/es/book/introducci%C3%B3n-al-modelamiento-y-simulaci%C3%B3n-de-microredes-de-energ%C3%ADa/isbn/978-3-639-63529-4
Introducción al Modelamiento y Simulación de Microredes de Energía
Un acercamiento a los sistemas eléctricos del futuro mediante la ingeniería, física, matemática y programación
Editorial Académica Española (2016-10-25 )
ISBN-13:978-3-639-63529-4
ISBN-10:3639635299
EAN:9783639635294
Idioma del libro:
Notas y citas / Texto breve:
En el libro desarrollo el modelamiento y simulación de una microred (microgrid) de voltaje continuo/alterno alimentado con fuentes solar fotovoltaica, eólica, de almacenamiento, una red eléctrica convencional (red de empresa pública o privada de electricidad) y que posee además cargas eléctricas. En dicha microgrid se realiza la evaluación del comportamiento de los parámetros del sistema: voltaje, corriente, potencia y energía eléctrica, en condiciones normales de funcionamiento. Matlab/Simulink de MathWork Inc. es la herramienta de simulación usada y los códigos son dados en Anexos. El libro está pensando para un amplio círculo de lectores, entre: (a) estudiantes de pregrado y postgrado de diferentes carreras relacionadas a la temática de microgrids, energias renovables y energia en general, como son de ingeniería mecanica, eléctrica, electrónica y electromecanico; física, matemática, computacion, economía, entre otras; (b) empresarios y profesionales que desean especializarse o ampliar sus conocimientos en energías renovables y/o modelamiento matemático y simulación numérica; (c) autoridades y público en general interesados en temas de energía.
Editorial: Editorial Académica Española
Sitio web: https://www.eae-publishing.com
Por (autor): Jorge Luis Mírez Tarrillo
Número de páginas: 240
Publicado en: 2016-10-25
Categoría: Tecnología
Palabras clave: Energías renovables, Microred, Modelamiento y Simulación, sistema eléctrico, Matlab Simulink
(Dénle Me gusta en mi Fanpage personal: http://www.facebook.com/jorgemirez )
Dr. Jorge Luis Mírez Tarrillo
Group of Mathematical Modeling and Numerical Simulation (GMMNS).
Universidad Nacional de Ingeniería. Lima, Perú.
E-mail: jmirez@uni.edu.pe
Website Personal: https://jorgemirez2002.wixsite.com/jorgemirez
Facebook http://www.facebook.com/jorgemirezperu
Linkedin https://www.linkedin.com/in/jorge-luis-mirez-tarrillo-94918423/
Scopus ID: https://www.scopus.com/authid/detail.uri?authorId=56488109800
Google Scholar: https://scholar.google.com/citations?user=_dSpp4YAAAAJ
MATLAB Group Admin in Facebook: https://www.facebook.com/groups/Matlab.Simulink.for.All
WhatsApp Channel/Canal: https://whatsapp.com/channel/0029VbCvpZsAYlUSz2esek2y
Los sistemas eléctricos en el futuro próximo cercano van a tener que ser inteligentes por obligación competitiva entre empresas eléctricas a fin de optimizar y mejorar sus prestaciones, esto sumado a la implementación de tecnologías de energías renovables, generación distribuida, entre otras. En especial énfasis la distribución dado que promueve los activos de generación. Ante ello un nuevo marco de transmisión y distribución se hace necesario en muchos países, siendo el marco regulativo de distribución el de mayor desafío. Incluyendo la interacción con los clientes, los cuales son más activos ahora, por ejemplo, ahora se tiene que si llaman varios clientes de una misma zona se deduce que se tiene una falla. Siendo ahora cada vez más importante en la vida diaria de las personas y las industrias se requiere cambios de índices de continuidad de suministro (1) continuidad, cantidad y tiempo de cortes, (2) calidad del producto eléctrico: armónicas, flicker’s, voltaje, frecuencia, factor de potencia y (3) atención comercial. Además, se debe tener esquemas de tarifa muy óptimos y generales de tal manera que las empresas tengan una perspectiva en el tiempo estable y lo menos complicado posible. Los marcos regulatorios (regulativos) contemplados desde hace años no se adaptan a la modernidad existente.
Dr. Jorge Luis Mírez Tarrillo
Group of Mathematical Modeling and Numerical Simulation (GMMNS).
Universidad Nacional de Ingeniería. Lima, Perú.
E-mail: jmirez@uni.edu.pe
Website Personal: https://jorgemirez2002.wixsite.com/jorgemirez
Facebook http://www.facebook.com/jorgemirezperu
Linkedin https://www.linkedin.com/in/jorge-luis-mirez-tarrillo-94918423/
Scopus ID: https://www.scopus.com/authid/detail.uri?authorId=56488109800
Google Scholar: https://scholar.google.com/citations?user=_dSpp4YAAAAJ
MATLAB Group Admin in Facebook: https://www.facebook.com/groups/Matlab.Simulink.for.All
WhatsApp Channel/Canal: https://whatsapp.com/channel/0029VbCvpZsAYlUSz2esek2y

En Perú – mi país – la manifestaciones de energía geotérmica son debidos principalmente a la interacción entre la placa oceánica de Nazca que se desplaza hacia el interior y por debajo de la placa continental. Esto se llama movimiento convergente de las placas. Cerca a la costa hay una parte profunda que por coincidencias de la naturaleza se llama el uppelling peruano, generador de la gran riqueza marina y que espero se conserve para la alimentación de la población peruana (dado que tenemos una fuente excelente de alimentación, pero tenemos 14 % de niños con desnutrición) ya que se lee en noticias que eso lo venden a las empresas extranjeras y el Ministerio del Medio Ambiente está pintado. En la parte central del Océano Pacífico asciende magma del interior de la Tierra lo cual es un movimiento divergente de las placas oceánicas. Recordar que el manto tiene 1.5% de material fundido que es sobre el cual la corteza terrestre «flota» y basta temperaturas de 700 °C para que las rocas de la placa de Nazca que se desplazan hacia abajo y por debajo de la placa continental se fundan. Hay zonas propensas de terremotos por lo general ubicados en lo que corresponde al Cinturón de Fuego del Pacífico. En el Sur de Perú y Chile hay volcanes bastante activos y muchas manifestaciones en superficie (fumarolas, aguas termales, etc) de indicios de anomalías térmicas que implica una cercanía del magma a la superficie terrestre o la presencia de fallas o fisuras que permiten ello. Con importancia para quienes deseen realizar investigaciones en la determinación de potenciales recursos geotérmicos y la predicción de terremotos…
Dr. Jorge Luis Mírez Tarrillo
Group of Mathematical Modeling and Numerical Simulation (GMMNS).
Universidad Nacional de Ingeniería. Lima, Perú.
E-mail: jmirez@uni.edu.pe
Website Personal: https://jorgemirez2002.wixsite.com/jorgemirez
Facebook http://www.facebook.com/jorgemirezperu
Linkedin https://www.linkedin.com/in/jorge-luis-mirez-tarrillo-94918423/
Scopus ID: https://www.scopus.com/authid/detail.uri?authorId=56488109800
Google Scholar: https://scholar.google.com/citations?user=_dSpp4YAAAAJ
MATLAB Group Admin in Facebook: https://www.facebook.com/groups/Matlab.Simulink.for.All
WhatsApp Channel/Canal: https://whatsapp.com/channel/0029VbCvpZsAYlUSz2esek2y

En el presente post se muestra los datos del Ministerio de Energía y Minas del Perú en cuanto a los lugares con potencial para la generación de electricidad a partir de fuentes geotérmicas. Se puede observar la ubicación del campo geotérmico, su potencial capacidad efectiva de generación MWe y la región en que se ubica cada uno de ellos – incluye la región política y la región geotérmica (algo que hemos tratado en el post anterior) – lo que sumando capacidades sale que se podrían obtener unos 2,880 MW de electricidad, lo cual es casi la tercera parte de la capacidad instalada de generación en Perú e implicaría una notable reducción de la huella de carbono del sistema electroenergético peruano. Hay unos campos más promisorios que otros. La recomendación sería que quizás algunas buenas autoridades locales y/o regionales, hagan esfuerzos de gestión de cooperación internacional para que dichos proyectos se hagan realidad y tengamos por ejemplo: empresas eléctricas regionales públicas rentables y fiables – rescato acá el ejemplo de la Empresa de Electricidad de Arequipa en el Sur del Perú y que cuando el Gobierno Peruano la quería privatizar, bueno Arequipa no se deja… es por ello que sigue siendo Arequipa y dicha Empresa Eléctrica Pública continúa. Bolivia es el otro ejemplo. Quizás ambos tengan también sus deficiencias, a lo que voy es que con buena gestión, compromiso de las personas y claridad en la gestión se puede hacer muchas cosas desde el sector público.
Dr. Jorge Luis Mírez Tarrillo
Group of Mathematical Modeling and Numerical Simulation (GMMNS).
Universidad Nacional de Ingeniería. Lima, Perú.
E-mail: jmirez@uni.edu.pe
Website Personal: https://jorgemirez2002.wixsite.com/jorgemirez
Facebook http://www.facebook.com/jorgemirezperu
Linkedin https://www.linkedin.com/in/jorge-luis-mirez-tarrillo-94918423/
Scopus ID: https://www.scopus.com/authid/detail.uri?authorId=56488109800
Google Scholar: https://scholar.google.com/citations?user=_dSpp4YAAAAJ
MATLAB Group Admin in Facebook: https://www.facebook.com/groups/Matlab.Simulink.for.All
WhatsApp Channel/Canal: https://whatsapp.com/channel/0029VbCvpZsAYlUSz2esek2y

As Figure demonstrates, the existing electricity grid is a strictly hierarchical system in which power plants at the top of the chain ensure power delivery to customers’ loads at the bottom of the chain. The system is essentially a oneway pipeline where the source has no real-time information about the service parameters of the termination points. The grid is therefore overengineered to withstand maximum anticipated peak demand across its aggregated load. And since this peak demand is an infrequent occurrence, the system is inherently inefficient. Moreover, an unprecedented rise in demand for electrical power, coupled with lagging investments in the electrical power infrastructure, has decreased system stability. With the safe margins exhausted, any unforeseen surge in demand or anomalies across the distribution network causing component failures can trigger catastrophic blackouts.
Source:
Hassan Farhangi “The Path of the Smart Grid” IEEE Power & Energy Mazagine. January/February 2010. Pag 18 -28.
Dr. Jorge Luis Mírez Tarrillo
Group of Mathematical Modeling and Numerical Simulation (GMMNS).
Universidad Nacional de Ingeniería. Lima, Perú.
E-mail: jmirez@uni.edu.pe
Website Personal: https://jorgemirez2002.wixsite.com/jorgemirez
Facebook http://www.facebook.com/jorgemirezperu
Linkedin https://www.linkedin.com/in/jorge-luis-mirez-tarrillo-94918423/
Scopus ID: https://www.scopus.com/authid/detail.uri?authorId=56488109800
Google Scholar: https://scholar.google.com/citations?user=_dSpp4YAAAAJ
MATLAB Group Admin in Facebook: https://www.facebook.com/groups/Matlab.Simulink.for.All
WhatsApp Channel/Canal: https://whatsapp.com/channel/0029VbCvpZsAYlUSz2esek2y

The overall procedure is the following:
1. The Market Operator (MO) announces the prices for selling (SP) or buying (BP) energy to the Microgrid. Normally it is SP>BP.
2. The local loads announce their demands for the next 15 minutes and an initial price (DP) for the kWh. It is DP>BPand DP<SP.
3. The production units accept or decline the load offer according to an Auction Price (AP).
4. The negotiation continues for a specific time (5 min).
5. After the end of the negotiation time, all the units have adjusted their set points. If there is no production unit within the Microgrid to satisfy the load demand, the power is bought from the grid. In addition, the grid can be considered as a load too, so the production or storage units can sell energy to the grid.
Source:
Aris L. Dimeas, Nikos D. Natziargyriou “Operation of Multiagent System for Microgrid Control” IEEE Transactions on Power Systems, Vol. 20, No. 3, August 2005.
Dr. Jorge Luis Mírez Tarrillo
Group of Mathematical Modeling and Numerical Simulation (GMMNS).
Universidad Nacional de Ingeniería. Lima, Perú.
E-mail: jmirez@uni.edu.pe
Website Personal: https://jorgemirez2002.wixsite.com/jorgemirez
Facebook http://www.facebook.com/jorgemirezperu
Linkedin https://www.linkedin.com/in/jorge-luis-mirez-tarrillo-94918423/
Scopus ID: https://www.scopus.com/authid/detail.uri?authorId=56488109800
Google Scholar: https://scholar.google.com/citations?user=_dSpp4YAAAAJ
MATLAB Group Admin in Facebook: https://www.facebook.com/groups/Matlab.Simulink.for.All
WhatsApp Channel/Canal: https://whatsapp.com/channel/0029VbCvpZsAYlUSz2esek2y

There is a significative difference storage system and electric power system interconnection unit. The microgrid usually has as high power from grid point of view that it is connected to medium voltage fine, typically 15 kV in Poland. Although the power system interconnection unit has almost the structure as storage system, its primary voltage is in range of kilovolts and is sinusoidal. So, it requires different power electronic converter. It is assumed in Poland that all devices connected to 15 kV lines have to be joined using 50 Hz transformer. Hence, the grid interconnection unit can have a structure shown in Figure.
Source:
Piotr Biczel. “Power Electronic Converters in DC Microgrid”. IEEE 5th International Conference – Workshop, Compatibility in Power Electronics, CPE 2007. Poland.
Dr. Jorge Luis Mírez Tarrillo
Group of Mathematical Modeling and Numerical Simulation (GMMNS).
Universidad Nacional de Ingeniería. Lima, Perú.
E-mail: jmirez@uni.edu.pe
Website Personal: https://jorgemirez2002.wixsite.com/jorgemirez
Facebook http://www.facebook.com/jorgemirezperu
Linkedin https://www.linkedin.com/in/jorge-luis-mirez-tarrillo-94918423/
Scopus ID: https://www.scopus.com/authid/detail.uri?authorId=56488109800
Google Scholar: https://scholar.google.com/citations?user=_dSpp4YAAAAJ
MATLAB Group Admin in Facebook: https://www.facebook.com/groups/Matlab.Simulink.for.All
WhatsApp Channel/Canal: https://whatsapp.com/channel/0029VbCvpZsAYlUSz2esek2y

This a typical scheme of a microgrid AC/DC. It maybe contain many technologies as micro-source, storage, loads and monitoring and control. Un Microgrid Bus linked the different components.
Source:
N. R. Rahmanov, N. M. Tabatabaei, K. Dursun, O. Z. Kerimov. «Combined AC-DC Microgrids: Case Study – Network Development and Simulation» International Journal on Technical and Physical Problems of Engineering. September 2012, Issue 12, Volume 4, Number 3, Pages 157 – 161.
Dr. Jorge Luis Mírez Tarrillo
Group of Mathematical Modeling and Numerical Simulation (GMMNS).
Universidad Nacional de Ingeniería. Lima, Perú.
E-mail: jmirez@uni.edu.pe
Website Personal: https://jorgemirez2002.wixsite.com/jorgemirez
Facebook http://www.facebook.com/jorgemirezperu
Linkedin https://www.linkedin.com/in/jorge-luis-mirez-tarrillo-94918423/
Scopus ID: https://www.scopus.com/authid/detail.uri?authorId=56488109800
Google Scholar: https://scholar.google.com/citations?user=_dSpp4YAAAAJ
MATLAB Group Admin in Facebook: https://www.facebook.com/groups/Matlab.Simulink.for.All
WhatsApp Channel/Canal: https://whatsapp.com/channel/0029VbCvpZsAYlUSz2esek2y

During operation a microgrid, sometimes; renewable energy sources and the external power grid, dispatched electric energy simultaneously. Sometimes, many sources is neccesary for supply to electric load. Also, all it, considering both economic and technical criteria. The figure represent la connection and disconnetion of sources for each state of performance of a microgrid. Too, it is applicable to other similar electric systems.
Dr. Jorge Luis Mírez Tarrillo
Group of Mathematical Modeling and Numerical Simulation (GMMNS).
Universidad Nacional de Ingeniería. Lima, Perú.
E-mail: jmirez@uni.edu.pe
Website Personal: https://jorgemirez2002.wixsite.com/jorgemirez
Facebook http://www.facebook.com/jorgemirezperu
Linkedin https://www.linkedin.com/in/jorge-luis-mirez-tarrillo-94918423/
Scopus ID: https://www.scopus.com/authid/detail.uri?authorId=56488109800
Google Scholar: https://scholar.google.com/citations?user=_dSpp4YAAAAJ
MATLAB Group Admin in Facebook: https://www.facebook.com/groups/Matlab.Simulink.for.All
WhatsApp Channel/Canal: https://whatsapp.com/channel/0029VbCvpZsAYlUSz2esek2y

In a microgrid, each energy source is required according to the criterion of costs and production capacity. During the operation time, accumulative energy from each source is represented in the figure. Criteria of linear optimization has been used in this modelling and simulation. This allows determining the nominal capacity and the ability to respond to sudden requests. Made on Matlab of MathWorks Inc.
Dr. Jorge Luis Mírez Tarrillo
Group of Mathematical Modeling and Numerical Simulation (GMMNS).
Universidad Nacional de Ingeniería. Lima, Perú.
E-mail: jmirez@uni.edu.pe
Website Personal: https://jorgemirez2002.wixsite.com/jorgemirez
Facebook http://www.facebook.com/jorgemirezperu
Linkedin https://www.linkedin.com/in/jorge-luis-mirez-tarrillo-94918423/
Scopus ID: https://www.scopus.com/authid/detail.uri?authorId=56488109800
Google Scholar: https://scholar.google.com/citations?user=_dSpp4YAAAAJ
MATLAB Group Admin in Facebook: https://www.facebook.com/groups/Matlab.Simulink.for.All
WhatsApp Channel/Canal: https://whatsapp.com/channel/0029VbCvpZsAYlUSz2esek2y

In Europe this growth is driven by both national and EU policies. By 2008 the EU member states had adopted longterm targets in three different areas of energy policy:
• a binding reduction in greenhouse gas emissions of 20% by 2020 compared to 1990; this target can be raised to 30% subject to the conclusion of binding international climate change agreements;
• a mandatory target for renewable energy sources such as wind, solar and biomass, which by 2020 must supply 20% of the EU’s final energy demand; and
• a voluntary agreement to cut EU energy consumption by 20% by 2020, compared to a reference projection.
The EU has also set a target of 10% renewable energy, including biofuels, in transport by 2020.
This new policy, with its increasing reliance on renewable sources, will change European energy systems radically within the next decade. Energy technologies based on variable sources, especially wind power but to a lesser extent also wave power and PV, are expected to play a large role in the future energy supply. For example, by 2020 wind power is expected to supply 50% of the Danish electricity consumption – implying that from time to time significantly more wind power will be available than Denmark can consume1. This challenge will require not only significant changes in energy system structure, but also the development of intelligence within the system
Source:
Riso Energy Report 8. “The intelligent energy system infraestructure for the future”. Riso National Laboratory. Technical University of Denmark. September 2009. ISBN 978-87-550-3754-0
Dr. Jorge Luis Mírez Tarrillo
Group of Mathematical Modeling and Numerical Simulation (GMMNS).
Universidad Nacional de Ingeniería. Lima, Perú.
E-mail: jmirez@uni.edu.pe
Website Personal: https://jorgemirez2002.wixsite.com/jorgemirez
Facebook http://www.facebook.com/jorgemirezperu
Linkedin https://www.linkedin.com/in/jorge-luis-mirez-tarrillo-94918423/
Scopus ID: https://www.scopus.com/authid/detail.uri?authorId=56488109800
Google Scholar: https://scholar.google.com/citations?user=_dSpp4YAAAAJ
MATLAB Group Admin in Facebook: https://www.facebook.com/groups/Matlab.Simulink.for.All
WhatsApp Channel/Canal: https://whatsapp.com/channel/0029VbCvpZsAYlUSz2esek2y

One question that most system operators are concerned with is the optimised DG penetration level. Relationship regarding different cost models between optimum DG penetration level and interruption frequency is indicated in Figure.
Optimum micro-source penetration level is positive related with the interruption frequency without DG penetration; especially for average interruption costs, the relationship is almost linear. This relationship is important for systemplanning; as the system interruption frequency without DG penetration is generally known, the system operator is able to roughly determine of the optimum DG penetration level from reliability point of view
Dr. Jorge Luis Mírez Tarrillo
Group of Mathematical Modeling and Numerical Simulation (GMMNS).
Universidad Nacional de Ingeniería. Lima, Perú.
E-mail: jmirez@uni.edu.pe
Website Personal: https://jorgemirez2002.wixsite.com/jorgemirez
Facebook http://www.facebook.com/jorgemirezperu
Linkedin https://www.linkedin.com/in/jorge-luis-mirez-tarrillo-94918423/
Scopus ID: https://www.scopus.com/authid/detail.uri?authorId=56488109800
Google Scholar: https://scholar.google.com/citations?user=_dSpp4YAAAAJ
MATLAB Group Admin in Facebook: https://www.facebook.com/groups/Matlab.Simulink.for.All
WhatsApp Channel/Canal: https://whatsapp.com/channel/0029VbCvpZsAYlUSz2esek2y
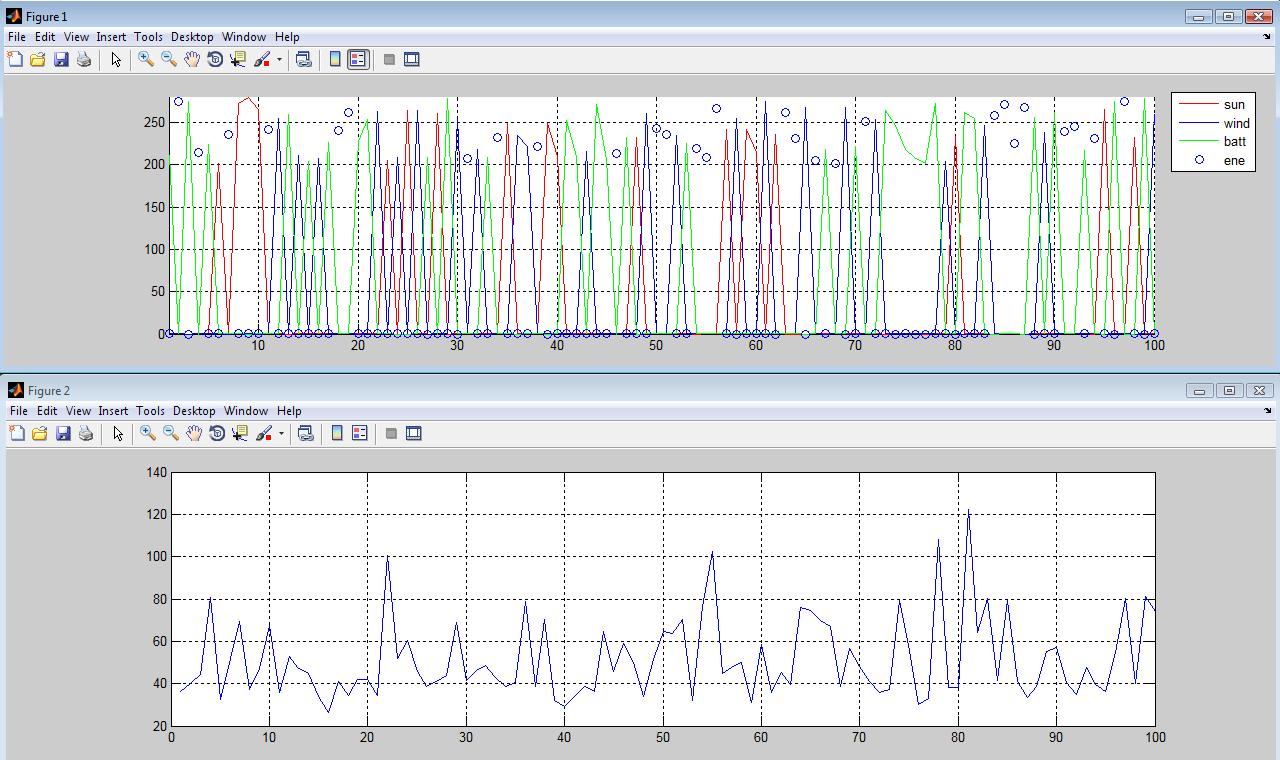
Usually the microgrid used wind turbine (wind), PV (sun), battery (batt) and load, aditional it have a PCC with electrical network external (ene). Both the technical operation as the economic operation are important during performance microgrid. In the figure I show the results of optimization process with imaginary energy prices from diferent source mentioned. In top figure is the power distribution between sources and down figure the total cost of each state. Programming linear has been used in this modelling and simulations.
Dr. Jorge Luis Mírez Tarrillo
Group of Mathematical Modeling and Numerical Simulation (GMMNS).
Universidad Nacional de Ingeniería. Lima, Perú.
E-mail: jmirez@uni.edu.pe
Website Personal: https://jorgemirez2002.wixsite.com/jorgemirez
Facebook http://www.facebook.com/jorgemirezperu
Linkedin https://www.linkedin.com/in/jorge-luis-mirez-tarrillo-94918423/
Scopus ID: https://www.scopus.com/authid/detail.uri?authorId=56488109800
Google Scholar: https://scholar.google.com/citations?user=_dSpp4YAAAAJ
MATLAB Group Admin in Facebook: https://www.facebook.com/groups/Matlab.Simulink.for.All
WhatsApp Channel/Canal: https://whatsapp.com/channel/0029VbCvpZsAYlUSz2esek2y

Currently available DG technologies provide a wide variety of different active and reactive power generation options. The final configuration and operation schemes of a microgrid depend on potentially conflicting interests among different stakeholders involved in electricity supply, such as system/network operators, DG owners, DG operators, energy suppliers, customers and regulatory bodies. Therefore, optimal operation scheduling in microgrids can have economic, technical and environmental objectives
Depending on the stakeholders involved in the planning or operation process, four different microgrid operational objectives can be identified: economic option, technical option, environmental option and combined objective option.
In the economic option, the objective function is to minimize total costs regardless of network impact/performance. This option may be envisaged by DG owners or operators. DGs are operated without concern for grid or emission obligations. The main limitations come from the physical constraints of DG.
The technical option optimizes network operation (minimizing power losses, voltage variation and device loading), without consideration of DG production costs and revenues. This option might be preferred by system operators.
The environmental option dispatches DG units with lower specific emission levels with higher priority, disregarding financial or technical aspects. This is preferred for meeting environmental targets, currently mainly supported by regulatory schemes. DG dispatch is solely determined by emission quota; only DG physical limitations are considered.
The combined objective option solves a multi-objective DG optimal dispatch problem, taking into account all economic, technical and environmental factors. It converts technical and environmental criteria into economic equivalents, considering constraints from both network and DG physical limits. This approach could be relevant, for instance, to actors that participate not only in classical energy markets, but also in other potential markets for provision of network services and emission certificates
Source:
MICROGRIDS: Architectures and Control
Nikos Hatziargynou
Dr. Jorge Luis Mírez Tarrillo
Group of Mathematical Modeling and Numerical Simulation (GMMNS).
Universidad Nacional de Ingeniería. Lima, Perú.
E-mail: jmirez@uni.edu.pe
Website Personal: https://jorgemirez2002.wixsite.com/jorgemirez
Facebook http://www.facebook.com/jorgemirezperu
Linkedin https://www.linkedin.com/in/jorge-luis-mirez-tarrillo-94918423/
Scopus ID: https://www.scopus.com/authid/detail.uri?authorId=56488109800
Google Scholar: https://scholar.google.com/citations?user=_dSpp4YAAAAJ
MATLAB Group Admin in Facebook: https://www.facebook.com/groups/Matlab.Simulink.for.All
WhatsApp Channel/Canal: https://whatsapp.com/channel/0029VbCvpZsAYlUSz2esek2y

La figura muestra el concepto de un sistema híbrido ac/dc donde varias fuentes y cargas ac y dc son conectadas a sus correspondientes redes ac y dc. Las redes ac y dc están conectadas a través de dos transformadores y conversores trifásicos ac/dc bidireccionales. Pueden observar la diversidad de micro fuentes que se está utilizando en la descripción de la microred, incluye los diferentes dispositivos de electrónica de potencia que sirven para adecuar la energía eléctrica desde fuentes y para cargas eléctricas. Hay vehículos eléctricos conectados a la microred. Los generadores eólicos tienen diferentes configuración de control (diferentes tipos de turbinas eólicas). Un grupo electrógeno diesel también se da, dado que estos grupos se consideran los que en último caso darán energía a la microred eléctrica en situaciones ya críticas pero a la vez rentables en lo posible en economía. Para todo esto se crea modelos matemáticos de cada elemento y luego se integran en un solo programa en que se puedan cambiar las condiciones de trabajo y analizar las variables de respuesta de lo que se desea estudiar. Yo lo hago en Matlab/Simulink para quienes deseen que les brinde el servicio de asesoramiento.
The information related to this post for sale for US $ 10.00. You can make payments through PayPal account: jorgemirez2002@gmail.com or send an e-mail to receive PayPal invoice and make your payment quickly and easily. Tell us (through e-mail) the name of the input or inputs that interests you. // La información relacionada con este post en venta por US $ 10.00. Usted puede hacer pagos a través de cuenta PayPal: jorgemirez2002@gmail.com o enviar un e-mail para recibir la factura de PayPal y hacer su pago de forma rápida y sencilla. Díganos (por medio de email) el nombre de la entrada o entradas que le interese.
Dr. Jorge Luis Mírez Tarrillo
Group of Mathematical Modeling and Numerical Simulation (GMMNS).
Universidad Nacional de Ingeniería. Lima, Perú.
E-mail: jmirez@uni.edu.pe
Website Personal: https://jorgemirez2002.wixsite.com/jorgemirez
Facebook http://www.facebook.com/jorgemirezperu
Linkedin https://www.linkedin.com/in/jorge-luis-mirez-tarrillo-94918423/
Scopus ID: https://www.scopus.com/authid/detail.uri?authorId=56488109800
Google Scholar: https://scholar.google.com/citations?user=_dSpp4YAAAAJ
MATLAB Group Admin in Facebook: https://www.facebook.com/groups/Matlab.Simulink.for.All
WhatsApp Channel/Canal: https://whatsapp.com/channel/0029VbCvpZsAYlUSz2esek2y
Blog in ENGLISH

Compra/Buy – Haz una donación/Make a donation

Dear reader, if you wish to make a donation or are interested in any information or code, please contact me (e-mail: jmirez@uni.edu.pe). Donations will allow you to continue studying and researching, and also to provide more information on this blog. My PayPal account is jorgemirez2002@gmail.com or if it is by bank transfer write to my email jmirez@uni.edu.pe. Any amount of money is welcome. Thank you.
Estimado lector, si desean hacer una donación o le interesa alguna información o código, favor ponerse en contacto con mi persona (e-mail: jmirez@uni.edu.pe). Las donaciones va a permitir seguir estudiando e investigando, y además, el poder brindar más información en este blog. Mi cuenta en PayPal es jorgemirez2002@gmail.com o si es por transferencia bancaria escribirme a mi correo jmirez@uni.edu.pe. Cualquier cantidad de dinero es bienvenido. Gracias.
Datos Generales
Good day. My full name is Jorge Luis MIREZ TARRILLO.
I am Peruvian and live in Lima, capital of Perú in South America.I am Mechanical Electrical Engineering, MSc Physics and Dr. Physics (title doctoral thesis: Control, Optimization, and Management of Microgrid Current Direct)
Too, actually job as Principal Professor in Faculty of Oil, Gas and Petrochemical Engineering of Universidad Nacional de Ingeniería (National University of Engineering) in Lima – PERU (Courses: Modern Physics, Differential Equations and Research's Methodology)
My subjects of my interest are control, signal processing, optimization, simulation, biomedical research, smart grid, microgrid, water.
I have experience in Matlab/Simulink programming, biomedical equipment, electrical systems, renewable energies, microgrids, saturated steam systems 100 psi and organizing academic events.
Comentarios Recientes
Elementos que compon… en J506: Los elementos de un paqu… Dr. Jorge Mírez en Message by IEEE Community Dr. Jorge Mírez en J546: Simulación de campos mag… jose luis huayanay v… en Message by IEEE Community Cesar Aviles en J546: Simulación de campos mag… Dr. Jorge Mírez en J518: La herramienta pdetool d… Dr. Jorge Mírez en J496: Simulación en Matlab/Sim… Raúl Barrios Elizarr… en J496: Simulación en Matlab/Sim… jose luis huayanay v… en J518: La herramienta pdetool d… MSc. Jorge Mírez en J281: La Rosa de Vientos: Frec…
Debe estar conectado para enviar un comentario.