Archive for the ‘Recurso natural’ Category
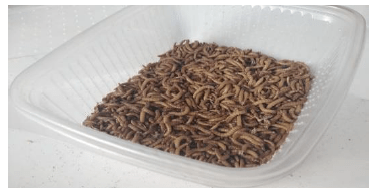
Buenas horas. Resulta que no siempre hay que crear una solución basada en máquinas o similares para solucionar un problema. Podemos ayudarnos de otros seres vivos que en la Naturaleza por miles, millones de años han hecho una labor de limpieza o cambios del entorno. Por ejemplo se tienen los gusanos (como el Tenebrio Mollitor) que pueden digerir plásticos en forma de espuma, los deboran y digieren limpiando el medio ambiente de estos plásticos que de manera natural demorarían decenas y quizás cientos de años en ser degradadas. De manera similar, habrán muchos casos similares que se deben investigar, modelar y simular su comportamiento en escala mayor para saber su influencia en la comunidad y los beneficios que puede traer a la humanidad. El modelamiento matemático es muy útil en esto, y para que tomen vida realizo las simulaciones en MATLAB/Simulink.
Dr. Jorge Luis Mírez Tarrillo
Group of Mathematical Modeling and Numerical Simulation (GMMNS).
Universidad Nacional de Ingeniería. Lima, Perú.
E-mail: jmirez@uni.edu.pe
Website Personal: https://jorgemirez2002.wixsite.com/jorgemirez
Facebook http://www.facebook.com/jorgemirezperu
Linkedin https://www.linkedin.com/in/jorge-luis-mirez-tarrillo-94918423/
Scopus ID: https://www.scopus.com/authid/detail.uri?authorId=56488109800
Google Scholar: https://scholar.google.com/citations?user=_dSpp4YAAAAJ
MATLAB Group Admin in Facebook: https://www.facebook.com/groups/Matlab.Simulink.for.All
WhatsApp Channel/Canal: https://whatsapp.com/channel/0029VbCvpZsAYlUSz2esek2y
Estimados lectores, en la figura se puede apreciar la proyección de Gt (gigatoneladas) de dióxido de carbono y del producto bruto interno per-cápita bajo dos escenarios: STEPS (escenario basado en las actuales políticas), APS (escenario de compromisos anunciados). En el STEPS, las emisiones globales caen 1 % por año entre el 2030 y 2050, mientras que en APS las emisiones globales caen 4 % por año. Dato adicionales, en un escenario del tipo NZE (escenario de cero emisiones netas al 2050) las emisiones globales caerían 15 % por año. Seguir lo trazado por el STEPS implica un incremento de la temperatura promedio global de 2.4 °C para el año 2100; mientras que en el APS, el incremento sería 1.7 °C, y; el NZE persigue hacer todo lo posible para no pasar los 1.5 °C. La figura muestra a los principales actores de la economía mundial, sin embargo, sería interesante investigar por país y dentro de cada país, cuanto están emitiendo, cuanto podrían dejar de emitir, o que se haga modelamiento matemático en base a los datos que se tienen o la realización de estimaciones. Todo suma en la preservación de nuestro planeta y en el asegurar la continuidad de la especie humana.

Dr. Jorge Luis Mírez Tarrillo
Group of Mathematical Modeling and Numerical Simulation (GMMNS).
Universidad Nacional de Ingeniería. Lima, Perú.
E-mail: jmirez@uni.edu.pe
Website Personal: https://jorgemirez2002.wixsite.com/jorgemirez
Facebook http://www.facebook.com/jorgemirezperu
Linkedin https://www.linkedin.com/in/jorge-luis-mirez-tarrillo-94918423/
Scopus ID: https://www.scopus.com/authid/detail.uri?authorId=56488109800
Google Scholar: https://scholar.google.com/citations?user=_dSpp4YAAAAJ
MATLAB Group Admin in Facebook: https://www.facebook.com/groups/Matlab.Simulink.for.All
WhatsApp Channel/Canal: https://whatsapp.com/channel/0029VbCvpZsAYlUSz2esek2y
Sustainable Thermal Energy Storage Systems: A Mathematical Model of the “Waru-Waru” Agricultural Technique Used in Cold Environments
by Jorge Luis Mírez Tarrillo
Group of Mathematical Modeling and Numerical Simulation, Faculty of Oil, Natural Gas and Petrochemical Engineering, Universidad Nacional de Ingeniería, Av. Tupac Amaru 210, Rimac 15333, Peru
Energies 2025, 18(12), 3116; https://doi.org/10.3390/en18123116
Sitio web: https://www.mdpi.com/1996-1073/18/12/3116

Dr. Jorge Luis Mírez Tarrillo
Group of Mathematical Modeling and Numerical Simulation (GMMNS).
Universidad Nacional de Ingeniería. Lima, Perú.
E-mail: jmirez@uni.edu.pe
Website Personal: https://jorgemirez2002.wixsite.com/jorgemirez
Facebook http://www.facebook.com/jorgemirezperu
Linkedin https://www.linkedin.com/in/jorge-luis-mirez-tarrillo-94918423/
Scopus ID: https://www.scopus.com/authid/detail.uri?authorId=56488109800
Google Scholar: https://scholar.google.com/citations?user=_dSpp4YAAAAJ
MATLAB Group Admin in Facebook: https://www.facebook.com/groups/Matlab.Simulink.for.All
WhatsApp Channel/Canal: https://whatsapp.com/channel/0029VbCvpZsAYlUSz2esek2y
Estimados lectores, retomando los temas de energías renovables y redes eléctricas avanzadas, les muestro acá una simulación de las pérdidas dieléctricas de cable (conductor de electricidad) cuya fórmula también se muestra en la figura. La figura muestra un comportamiento causi-real en que todos los parámetros cambian: la frecuencia, el voltaje y el factor de pérdidas del aislamiento. En éste caso, sólo cambian la frecuencia y el factor de pérdidas de aislamiento. El tiempo es referencial. Hecho en MATLAB/Simulink de MathWorks Inc.

Dr. Jorge Luis Mírez Tarrillo
Group of Mathematical Modeling and Numerical Simulation (GMMNS).
Universidad Nacional de Ingeniería. Lima, Perú.
E-mail: jmirez@uni.edu.pe
Website Personal: https://jorgemirez2002.wixsite.com/jorgemirez
Facebook http://www.facebook.com/jorgemirezperu
Linkedin https://www.linkedin.com/in/jorge-luis-mirez-tarrillo-94918423/
Scopus ID: https://www.scopus.com/authid/detail.uri?authorId=56488109800
Google Scholar: https://scholar.google.com/citations?user=_dSpp4YAAAAJ
MATLAB Group Admin in Facebook: https://www.facebook.com/groups/Matlab.Simulink.for.All
WhatsApp Channel/Canal: https://whatsapp.com/channel/0029VbCvpZsAYlUSz2esek2y
Todo artefacto, componente, máquina, sistema, etc… presenta un progresivo envejecimiento que conlleva a la falla de los equipos los cuales se van registrando durante los años de funcionamiento y con esa información se crea histogramas como el que se muestra en el presente post. Obviamente mientras más fallas se presentan la curva de distribución se forma mejor, y a partir de ello se puede normalizar y tener una función de probabilidad característica de la marca y modelo del equipo, máquina, etc. Elaborado con MATLAB para ustedes queda la gráfica.

Dr. Jorge Luis Mírez Tarrillo
Group of Mathematical Modeling and Numerical Simulation (GMMNS).
Universidad Nacional de Ingeniería. Lima, Perú.
E-mail: jmirez@uni.edu.pe
Website Personal: https://jorgemirez2002.wixsite.com/jorgemirez
Facebook http://www.facebook.com/jorgemirezperu
Linkedin https://www.linkedin.com/in/jorge-luis-mirez-tarrillo-94918423/
Scopus ID: https://www.scopus.com/authid/detail.uri?authorId=56488109800
Google Scholar: https://scholar.google.com/citations?user=_dSpp4YAAAAJ
MATLAB Group Admin in Facebook: https://www.facebook.com/groups/Matlab.Simulink.for.All
WhatsApp Channel/Canal: https://whatsapp.com/channel/0029VbCvpZsAYlUSz2esek2y
Link de Paper en IEEExplore:
https://ieeexplore.ieee.org/document/9359432
DOI: 10.1109/ICMEAE51770.2020.00043
Abstract:
Structure perovskite cells, with the general formula ABX3 and named after the mineral CaTiO3 [1], become good candidates for use in converting solar energy into electrical energy, because their efficiency increased in a short period from an initial 3.8 % to laboratory-scale energy conversion efficiency of 23.3 %, which rivals the performance of commercial multi-crystalline silicon solar cells [2]. Recently the power conversion efficiency (PCE) has reached 24.2 %. In addition, another important merit is its production cost, screen printing [3], roll to roll printing [4]. Another characteristic of the carbon electrode is that, due to its composition, it can transport the holes and does not need a hole-transporter material (HTM) or hole-transporter layer (HTL), unlike peroskite cells with metal. In [19] a study is reported where the storage stability of 1 year and PCE of 10.4 % (AM 1.5G, 100 mW/cm was reached in an area of 49 cm2 of mesoscopic carbon perovskites (CSPC).
Regards:
Dr. Jorge Luis Mírez Tarrillo
Group of Mathematical Modeling and Numerical Simulation (GMMNS).
Universidad Nacional de Ingeniería. Lima, Perú.
E-mail: jmirez@uni.edu.pe
Website Personal: https://jorgemirez2002.wixsite.com/jorgemirez
Facebook http://www.facebook.com/jorgemirezperu
Linkedin https://www.linkedin.com/in/jorge-luis-mirez-tarrillo-94918423/
Scopus ID: https://www.scopus.com/authid/detail.uri?authorId=56488109800
Google Scholar: https://scholar.google.com/citations?user=_dSpp4YAAAAJ
MATLAB Group Admin in Facebook: https://www.facebook.com/groups/Matlab.Simulink.for.All
WhatsApp Channel/Canal: https://whatsapp.com/channel/0029VbCvpZsAYlUSz2esek2y

Regards time, the ultimate consumer burns a fuel whose chemical composition varies, see Figure. These variations bring problems for plant operation, whatever is the prime mover (Internal Combustion engine, gas turbine or boiler).
Methane number (MN) characterizes gaseous fuel tendency to auto-ignition. By convention, this index has a value 100 for methane and 0 for hydrogen (Leiker et al., 1972). The gaseous fuels are thus compared with a methane-hydrogen binary mixture. Two gases with same value MN have the same resistance against the spontaneous combustion.
Source:
Natural Gas : Physical Properties and Combustion Features.
By Olivier Le Corre and Khaled Loubar
Dr. Jorge Luis Mírez Tarrillo
Group of Mathematical Modeling and Numerical Simulation (GMMNS).
Universidad Nacional de Ingeniería. Lima, Perú.
E-mail: jmirez@uni.edu.pe
Website Personal: https://jorgemirez2002.wixsite.com/jorgemirez
Facebook http://www.facebook.com/jorgemirezperu
Linkedin https://www.linkedin.com/in/jorge-luis-mirez-tarrillo-94918423/
Scopus ID: https://www.scopus.com/authid/detail.uri?authorId=56488109800
Google Scholar: https://scholar.google.com/citations?user=_dSpp4YAAAAJ
MATLAB Group Admin in Facebook: https://www.facebook.com/groups/Matlab.Simulink.for.All
WhatsApp Channel/Canal: https://whatsapp.com/channel/0029VbCvpZsAYlUSz2esek2y
Offshore wind has emerged as one of the most dynamic technologies in the energy system. For the first time in 2010 global capacity additions of offshore wind surpassed 1 gigawatt (GW). In 2018, a total of 4.3 GW of new offshore wind capacity was completed (see Figure). From 3 GW of offshore wind in operation in 2010, installed capacity expanded to
23 GW in 2018. Annual deployment has increased by nearly 30 % per year, higher than any other source of electricity except solar photovoltaics (PV). By mid-2019, there were over 5,500 offshore turbines connected to a grid in 17 countries. Policy support has been fundamental to this expansion, including through technology-specific capacity tenders, progress on including offshore wind in marine planning, financial support and regulatory efforts to support grid development.
The growth of the offshore wind industry has been fostered in European countries bordering the North Seas, where high quality wind resources and relatively shallow water have provided exceptionally good conditions in which to develop offshore wind technologies and bring them to market. Stable policies supported nearly 17 GW of offshore
wind capacity additions in Europe between 2010 and 2018. The United Kingdom, Germany, Belgium, Netherlands and Denmark together added 2.7 GW of capacity in 2018 alone. China has recently taken strides forward on offshore wind and now stands among the market leaders. In 2018, China added 1.6 GW of offshore wind capacity, the most of any
country. This rapid growth has been driven by the government’s 13th Five-Year Plan, which called for 5 GW of offshore wind capacity to be completed by 2020, and for the establishment of supply chains to support further expansion thereafter.

Source: IEA Offshore Wind Outlook 2019 https://www.iea.org/
Regards:
Dr. Jorge Luis Mírez Tarrillo
Group of Mathematical Modeling and Numerical Simulation (GMMNS).
Universidad Nacional de Ingeniería. Lima, Perú.
E-mail: jmirez@uni.edu.pe
Website Personal: https://jorgemirez2002.wixsite.com/jorgemirez
Facebook http://www.facebook.com/jorgemirezperu
Linkedin https://www.linkedin.com/in/jorge-luis-mirez-tarrillo-94918423/
Scopus ID: https://www.scopus.com/authid/detail.uri?authorId=56488109800
Google Scholar: https://scholar.google.com/citations?user=_dSpp4YAAAAJ
MATLAB Group Admin in Facebook: https://www.facebook.com/groups/Matlab.Simulink.for.All
WhatsApp Channel/Canal: https://whatsapp.com/channel/0029VbCvpZsAYlUSz2esek2y
«A mathematical model of SmartValley for estimation of contribution of biomass to the electrical generation»
Jorge Mírez ; Segundo Horna ; Daniel Carranza
2019 IEEE International Autumn Meeting on Power, Electronics and Computing (ROPEC). Ixtapa, Mexico, Mexico
Abstract:
A mathematical model is presented for the estimation of the contribution of biomass to the generation of electricity for a valley as a geographical scope of application. Is considered that a valley has several species that are cultivated during the year and that have by-products of the harvest that we have considered as biomass that can be used for the production of electricity that would benefit the valley’s inhabiting community. We have called this integration between population and crops SmartValley, which leads to the use of monitoring, control, management and planning among the different agricultural-energy actors.
Link: https://ieeexplore.ieee.org/document/9057045
Gratefully for this news !!
Regards:
Dr. Jorge Luis Mírez Tarrillo – PERU
Facebook http://www.facebook.com/jorgemirezperu
Linkedin https://www.linkedin.com/in/jorge-luis-mirez-tarrillo-94918423/
E-mail: jmirez@uni.edu.pe
Dr. Jorge Luis Mírez Tarrillo
Group of Mathematical Modeling and Numerical Simulation (GMMNS).
Universidad Nacional de Ingeniería. Lima, Perú.
E-mail: jmirez@uni.edu.pe
Website Personal: https://jorgemirez2002.wixsite.com/jorgemirez
Facebook http://www.facebook.com/jorgemirezperu
Linkedin https://www.linkedin.com/in/jorge-luis-mirez-tarrillo-94918423/
Scopus ID: https://www.scopus.com/authid/detail.uri?authorId=56488109800
Google Scholar: https://scholar.google.com/citations?user=_dSpp4YAAAAJ
MATLAB Group Admin in Facebook: https://www.facebook.com/groups/Matlab.Simulink.for.All
WhatsApp Channel/Canal: https://whatsapp.com/channel/0029VbCvpZsAYlUSz2esek2y
«Energy Management of Distributed Resources in Microgrids». J. L. Mírez, H.R. Chamorro, C.A. Ordonez, R. Moreno. 2014 IEEE 5th Colombian Workshop on Circuits and Systems (CWCAS).
DOI: 10.1109/CWCAS.2014.6994607
Dr. Jorge Luis Mírez Tarrillo
Group of Mathematical Modeling and Numerical Simulation (GMMNS).
Universidad Nacional de Ingeniería. Lima, Perú.
E-mail: jmirez@uni.edu.pe
Website Personal: https://jorgemirez2002.wixsite.com/jorgemirez
Facebook http://www.facebook.com/jorgemirezperu
Linkedin https://www.linkedin.com/in/jorge-luis-mirez-tarrillo-94918423/
Scopus ID: https://www.scopus.com/authid/detail.uri?authorId=56488109800
Google Scholar: https://scholar.google.com/citations?user=_dSpp4YAAAAJ
MATLAB Group Admin in Facebook: https://www.facebook.com/groups/Matlab.Simulink.for.All
WhatsApp Channel/Canal: https://whatsapp.com/channel/0029VbCvpZsAYlUSz2esek2y
«Simulation of DC Microgrid and Study of Power and Battery Charge/Discharge Management». Jorge Mírez, Luis Hernández-Callejo, Manfred Horn, Luis Miguel Bonilla. DYNA Ingeniería e Industrial. November 2017 – Volume: 92 – Pages: 673-679.
DOI: http://dx.doi.org/10.6036/8475

Dr. Jorge Luis Mírez Tarrillo
Group of Mathematical Modeling and Numerical Simulation (GMMNS).
Universidad Nacional de Ingeniería. Lima, Perú.
E-mail: jmirez@uni.edu.pe
Website Personal: https://jorgemirez2002.wixsite.com/jorgemirez
Facebook http://www.facebook.com/jorgemirezperu
Linkedin https://www.linkedin.com/in/jorge-luis-mirez-tarrillo-94918423/
Scopus ID: https://www.scopus.com/authid/detail.uri?authorId=56488109800
Google Scholar: https://scholar.google.com/citations?user=_dSpp4YAAAAJ
MATLAB Group Admin in Facebook: https://www.facebook.com/groups/Matlab.Simulink.for.All
WhatsApp Channel/Canal: https://whatsapp.com/channel/0029VbCvpZsAYlUSz2esek2y
Ciclo de VideoConferencias en Vivo: Jueves 11 y Viernes 12 de julio 2019 desde las 21 a 23 horas (9 PM – 10 PM) – hora de Perú.
Hoy Viernes 12 de julio 2019 hablaré sobre «Principales componentes de una Turbina Eólica: Rotor, álabes, hub, transmisión, caja de engranajes, generador eléctrico, frenos, nacelle, torre»
La transmisión será desde mi fanpage http://www.facebook.com/jorgemirezperu — libre y gratuito. COMPARTIR !! e invitados a darle Like ![]() y con el auspicio de PERU Green Smart Energy SAC http://www.pgsesac.com
y con el auspicio de PERU Green Smart Energy SAC http://www.pgsesac.com
Esto se hace en a la literatura que venimos trabajando en el Curso de Fundamentos de la Energía Eólica en la Maestría de Energías Renovables y Eficiencia Energética de la Universidad Nacional de Ingeniería (UNI), Lima, Perú.
Dr. Jorge Luis Mírez Tarrillo
Group of Mathematical Modeling and Numerical Simulation (GMMNS).
Universidad Nacional de Ingeniería. Lima, Perú.
E-mail: jmirez@uni.edu.pe
Website Personal: https://jorgemirez2002.wixsite.com/jorgemirez
Facebook http://www.facebook.com/jorgemirezperu
Linkedin https://www.linkedin.com/in/jorge-luis-mirez-tarrillo-94918423/
Scopus ID: https://www.scopus.com/authid/detail.uri?authorId=56488109800
Google Scholar: https://scholar.google.com/citations?user=_dSpp4YAAAAJ
MATLAB Group Admin in Facebook: https://www.facebook.com/groups/Matlab.Simulink.for.All
WhatsApp Channel/Canal: https://whatsapp.com/channel/0029VbCvpZsAYlUSz2esek2y
Les dejo el video completo de la Transmisión en Vivo hecho el Domingo 16 de junio 2019 desde las 22 PM a 24 horas – hora de Perú. Charla sobre «Aspectos Básicos de Potencia/Energía Eléctrica en Turbinas Eólicas» en base a la literatura que venimos trabajando en la Maestría de Energías Renovables y Eficiencia Energética de la Universidad Nacional de Ingeniería (UNI), Lima, Perú. La transmisión será desde mi fanpagehttp://www.facebook.com/jorgemirezperu — libre y gratuito. COMPARTIR e invitados a darle Like ![]()
Dr. Jorge Luis Mírez Tarrillo
Group of Mathematical Modeling and Numerical Simulation (GMMNS).
Universidad Nacional de Ingeniería. Lima, Perú.
E-mail: jmirez@uni.edu.pe
Website Personal: https://jorgemirez2002.wixsite.com/jorgemirez
Facebook http://www.facebook.com/jorgemirezperu
Linkedin https://www.linkedin.com/in/jorge-luis-mirez-tarrillo-94918423/
Scopus ID: https://www.scopus.com/authid/detail.uri?authorId=56488109800
Google Scholar: https://scholar.google.com/citations?user=_dSpp4YAAAAJ
MATLAB Group Admin in Facebook: https://www.facebook.com/groups/Matlab.Simulink.for.All
WhatsApp Channel/Canal: https://whatsapp.com/channel/0029VbCvpZsAYlUSz2esek2y
PERU Green Smart Energy S.A.C. es una empresa peruana que se dedica al rubro de bienes y servicios en temas de ingeniería, energias renovables, expedientes técnicos, material audiovisual – publicitario y de capacitación, expedientes técnicos en ingenierias, arquitectura, ciencias de la salud, entre otros. También nos dedicamos a la investigación científica, cálculos técnicos y capacitación.
Gustoso de pertenecer a la familia de PGSE S.A.C. en donde doy toda mi experiencia y conocimientos.
Para más información, consultas y coordinaciones sobre los bienes y servicios que ofrecemos, visita nuestra página web:
Pronto comenzaremos con nuestras capacitaciones virtuales (en español) con certificación. Lo estaremos promocionando con tiempo, pero les recomendamos ser nuestros seguidores dándole click en Me Gusta ![]() de nuestro fanpage para mantenerse informado de las novedades
de nuestro fanpage para mantenerse informado de las novedades
Fanpage de PGSE S.A.C. (darle Me Gusta):
http://www.facebook.com/PeruGreenSmartEnergySAC
Atentamente:
Jorge Luis Mírez Tarrillo
Ing. Mecánico Electricista – MSc & Dr. Física.
Dr. Jorge Luis Mírez Tarrillo
Group of Mathematical Modeling and Numerical Simulation (GMMNS).
Universidad Nacional de Ingeniería. Lima, Perú.
E-mail: jmirez@uni.edu.pe
Website Personal: https://jorgemirez2002.wixsite.com/jorgemirez
Facebook http://www.facebook.com/jorgemirezperu
Linkedin https://www.linkedin.com/in/jorge-luis-mirez-tarrillo-94918423/
Scopus ID: https://www.scopus.com/authid/detail.uri?authorId=56488109800
Google Scholar: https://scholar.google.com/citations?user=_dSpp4YAAAAJ
MATLAB Group Admin in Facebook: https://www.facebook.com/groups/Matlab.Simulink.for.All
WhatsApp Channel/Canal: https://whatsapp.com/channel/0029VbCvpZsAYlUSz2esek2y

Tornados occur in most subtropical and temperate landmasses around the world. Fortunately, most tornados do not carry overwhelming winds and therefore cause limited structural damage to engineered structures. On average, 800 to 1,000 tornados occur each year in the contiguous United States, and the activity zone extends well up into Canada. The total number of reported tornados in 1-degree squares of latitude and longitude for a 30-year period (1950 to 1980) is shown in figure.
Dr. Jorge Luis Mírez Tarrillo
Group of Mathematical Modeling and Numerical Simulation (GMMNS).
Universidad Nacional de Ingeniería. Lima, Perú.
E-mail: jmirez@uni.edu.pe
Website Personal: https://jorgemirez2002.wixsite.com/jorgemirez
Facebook http://www.facebook.com/jorgemirezperu
Linkedin https://www.linkedin.com/in/jorge-luis-mirez-tarrillo-94918423/
Scopus ID: https://www.scopus.com/authid/detail.uri?authorId=56488109800
Google Scholar: https://scholar.google.com/citations?user=_dSpp4YAAAAJ
MATLAB Group Admin in Facebook: https://www.facebook.com/groups/Matlab.Simulink.for.All
WhatsApp Channel/Canal: https://whatsapp.com/channel/0029VbCvpZsAYlUSz2esek2y
Hoy jueves 27 diciembre 2018 recibí el Diploma de Doctor en Ciencias mención Física por la Universidad Nacional de Ingeniería, Lima, Perú. // Today, Thursday, December 27, 2018, I received the Diploma of Doctor of Sciences with mention in Physics (Dr. Physics) from the National University of Engineering, Lima, Peru.
Algunas fotos // some photos:

Recibiendo el diploma en Oficina de Grados y Títulos de la Universidad Nacional de Ingeniería, Lima, Perú. // Receiving a diploma in the Office of Degrees of the National University of Engineering, Lima, Peru.

En frente al Rectorado de la Universidad Nacional de Ingeniería, Lima, Perú // In front of the Rector’s Office of the National University of Engineering, Lima, Perú.

Con mi asesor Dr. Manfred Horn (a mi co-asesor Dr. Josep Guerrero en la Universidad de Aalborg, Dinamarca, muchas gracias también) // With my advisor Dr. Manfred Horn (a my co-advisor Dr. Josep Guerrero at the University of Aalborg, Denmark, thank you very much too) //
De mi fanpage // of my Fanpage:
Gracias a todos… A quienes estuvieron, están y/o estarán en este camino… Gracias por su espera, paciencia, enseñanzas, cariño, alegrías… estas cosas no se logran de la noche a la mañana… Queda aún algunos años para devolver lo recibido de la vida… Hoy jueves 27 Diciembre 2018 recibí el diploma de Doctor en Ciencias con mención en Física y al igual que mis grados y títulos anteriores me fue entregado en Ventanilla de una Oficina de Grados y Títulos y está bien, porque todos somos capaces, todos somos seres humanos… // Thank you all … Those who were, are and / or will be on this path … Thank you for your wait, patience, teachings, affection, joys … these things are not achieved overnight … There are still some years to return the received of life … Today, Thursday, December 27, 2018, I received a Doctor of Science degree with a mention in Physics and, like my previous degrees and diplomas, it was delivered to me in the Office of Degrees and Titles and that’s fine, because we’re all capable, we’re all human beings …. Fuente/Source: http://www.facebook.com/jorgemirezperu
Email: jmirez@uni.edu.pe
Dr. Jorge Luis Mírez Tarrillo
Group of Mathematical Modeling and Numerical Simulation (GMMNS).
Universidad Nacional de Ingeniería. Lima, Perú.
E-mail: jmirez@uni.edu.pe
Website Personal: https://jorgemirez2002.wixsite.com/jorgemirez
Facebook http://www.facebook.com/jorgemirezperu
Linkedin https://www.linkedin.com/in/jorge-luis-mirez-tarrillo-94918423/
Scopus ID: https://www.scopus.com/authid/detail.uri?authorId=56488109800
Google Scholar: https://scholar.google.com/citations?user=_dSpp4YAAAAJ
MATLAB Group Admin in Facebook: https://www.facebook.com/groups/Matlab.Simulink.for.All
WhatsApp Channel/Canal: https://whatsapp.com/channel/0029VbCvpZsAYlUSz2esek2y
En el presente post encuentan el PPT y audio de mi Conferencia: “Microrredes y Generación Distribuida». Diciembre 07, 2018. COIMTEECS. Universidad Nacional del Antiplano. Puno, Perú.
PPT:


AUDIO:
Dr. Jorge Luis Mírez Tarrillo
Group of Mathematical Modeling and Numerical Simulation (GMMNS).
Universidad Nacional de Ingeniería. Lima, Perú.
E-mail: jmirez@uni.edu.pe
Website Personal: https://jorgemirez2002.wixsite.com/jorgemirez
Facebook http://www.facebook.com/jorgemirezperu
Linkedin https://www.linkedin.com/in/jorge-luis-mirez-tarrillo-94918423/
Scopus ID: https://www.scopus.com/authid/detail.uri?authorId=56488109800
Google Scholar: https://scholar.google.com/citations?user=_dSpp4YAAAAJ
MATLAB Group Admin in Facebook: https://www.facebook.com/groups/Matlab.Simulink.for.All
WhatsApp Channel/Canal: https://whatsapp.com/channel/0029VbCvpZsAYlUSz2esek2y
El Escenario del Mapa BLUE estima que el sector del transporte representará el 10% del consumo total de electricidad para el año 2050 debido a un aumento significativo en vehículos eléctricos (EV) y vehículos eléctricos híbridos enchufables (PHEV) (Figura 5). Si la carga del vehículo no se gestiona de manera inteligente, podría aumentar la carga pico en la infraestructura eléctrica, lo que aumentaría las actuales demandas máximas de los sectores residencial y de servicios, y requeriría una gran inversión de infraestructura para evitar fallas en el suministro. La tecnología de red inteligente puede permitir que la carga se lleve a cabo de forma más estratégica, cuando la demanda es baja, haciendo uso de la generación de bajo costo y la capacidad adicional del sistema, o cuando la producción de electricidad a partir de fuentes renovables es alta. A largo plazo, la tecnología de red inteligente también podría permitir que los vehículos eléctricos devuelvan la electricidad almacenada en sus baterías al sistema cuando sea necesario.
En los Países Bajos, el proyecto colaborativo Mobile Smart Grid liderado por la distribuidora Enexis está estableciendo una red de sitios de recarga de automóviles eléctricos y está utilizando aplicaciones inteligentes de tecnología de información y comunicación (TIC) para permitir que la red eléctrica existente atienda la demanda de energía adicional. . Trabajando en conjunto con otros operadores de red, compañías de energía, proveedores de software y hardware, universidades y otros institutos de investigación, el proyecto debería resultar en soluciones simples para cargar y pagar automáticamente (Boots et al., 2010).

Dr. Jorge Luis Mírez Tarrillo
Group of Mathematical Modeling and Numerical Simulation (GMMNS).
Universidad Nacional de Ingeniería. Lima, Perú.
E-mail: jmirez@uni.edu.pe
Website Personal: https://jorgemirez2002.wixsite.com/jorgemirez
Facebook http://www.facebook.com/jorgemirezperu
Linkedin https://www.linkedin.com/in/jorge-luis-mirez-tarrillo-94918423/
Scopus ID: https://www.scopus.com/authid/detail.uri?authorId=56488109800
Google Scholar: https://scholar.google.com/citations?user=_dSpp4YAAAAJ
MATLAB Group Admin in Facebook: https://www.facebook.com/groups/Matlab.Simulink.for.All
WhatsApp Channel/Canal: https://whatsapp.com/channel/0029VbCvpZsAYlUSz2esek2y
Blog in ENGLISH

Compra/Buy – Haz una donación/Make a donation

Dear reader, if you wish to make a donation or are interested in any information or code, please contact me (e-mail: jmirez@uni.edu.pe). Donations will allow you to continue studying and researching, and also to provide more information on this blog. My PayPal account is jorgemirez2002@gmail.com or if it is by bank transfer write to my email jmirez@uni.edu.pe. Any amount of money is welcome. Thank you.
Estimado lector, si desean hacer una donación o le interesa alguna información o código, favor ponerse en contacto con mi persona (e-mail: jmirez@uni.edu.pe). Las donaciones va a permitir seguir estudiando e investigando, y además, el poder brindar más información en este blog. Mi cuenta en PayPal es jorgemirez2002@gmail.com o si es por transferencia bancaria escribirme a mi correo jmirez@uni.edu.pe. Cualquier cantidad de dinero es bienvenido. Gracias.
Datos Generales
Good day. My full name is Jorge Luis MIREZ TARRILLO.
I am Peruvian and live in Lima, capital of Perú in South America.I am Mechanical Electrical Engineering, MSc Physics and Dr. Physics (title doctoral thesis: Control, Optimization, and Management of Microgrid Current Direct)
Too, actually job as Principal Professor in Faculty of Oil, Gas and Petrochemical Engineering of Universidad Nacional de Ingeniería (National University of Engineering) in Lima – PERU (Courses: Modern Physics, Differential Equations and Research's Methodology)
My subjects of my interest are control, signal processing, optimization, simulation, biomedical research, smart grid, microgrid, water.
I have experience in Matlab/Simulink programming, biomedical equipment, electrical systems, renewable energies, microgrids, saturated steam systems 100 psi and organizing academic events.
Comentarios Recientes
Elementos que compon… en J506: Los elementos de un paqu… Dr. Jorge Mírez en Message by IEEE Community Dr. Jorge Mírez en J546: Simulación de campos mag… jose luis huayanay v… en Message by IEEE Community Cesar Aviles en J546: Simulación de campos mag… Dr. Jorge Mírez en J518: La herramienta pdetool d… Dr. Jorge Mírez en J496: Simulación en Matlab/Sim… Raúl Barrios Elizarr… en J496: Simulación en Matlab/Sim… jose luis huayanay v… en J518: La herramienta pdetool d… MSc. Jorge Mírez en J281: La Rosa de Vientos: Frec…
Debe estar conectado para enviar un comentario.