Archive for the ‘Natural Resource’ Category
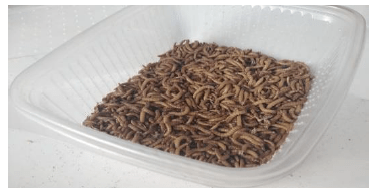
Buenas horas. Resulta que no siempre hay que crear una solución basada en máquinas o similares para solucionar un problema. Podemos ayudarnos de otros seres vivos que en la Naturaleza por miles, millones de años han hecho una labor de limpieza o cambios del entorno. Por ejemplo se tienen los gusanos (como el Tenebrio Mollitor) que pueden digerir plásticos en forma de espuma, los deboran y digieren limpiando el medio ambiente de estos plásticos que de manera natural demorarían decenas y quizás cientos de años en ser degradadas. De manera similar, habrán muchos casos similares que se deben investigar, modelar y simular su comportamiento en escala mayor para saber su influencia en la comunidad y los beneficios que puede traer a la humanidad. El modelamiento matemático es muy útil en esto, y para que tomen vida realizo las simulaciones en MATLAB/Simulink.
Dr. Jorge Luis Mírez Tarrillo
Group of Mathematical Modeling and Numerical Simulation (GMMNS).
Universidad Nacional de Ingeniería. Lima, Perú.
E-mail: jmirez@uni.edu.pe
Website Personal: https://jorgemirez2002.wixsite.com/jorgemirez
Facebook http://www.facebook.com/jorgemirezperu
Linkedin https://www.linkedin.com/in/jorge-luis-mirez-tarrillo-94918423/
Scopus ID: https://www.scopus.com/authid/detail.uri?authorId=56488109800
Google Scholar: https://scholar.google.com/citations?user=_dSpp4YAAAAJ
MATLAB Group Admin in Facebook: https://www.facebook.com/groups/Matlab.Simulink.for.All
WhatsApp Channel/Canal: https://whatsapp.com/channel/0029VbCvpZsAYlUSz2esek2y
Estimados lectores, en la figura se puede apreciar la proyección de Gt (gigatoneladas) de dióxido de carbono y del producto bruto interno per-cápita bajo dos escenarios: STEPS (escenario basado en las actuales políticas), APS (escenario de compromisos anunciados). En el STEPS, las emisiones globales caen 1 % por año entre el 2030 y 2050, mientras que en APS las emisiones globales caen 4 % por año. Dato adicionales, en un escenario del tipo NZE (escenario de cero emisiones netas al 2050) las emisiones globales caerían 15 % por año. Seguir lo trazado por el STEPS implica un incremento de la temperatura promedio global de 2.4 °C para el año 2100; mientras que en el APS, el incremento sería 1.7 °C, y; el NZE persigue hacer todo lo posible para no pasar los 1.5 °C. La figura muestra a los principales actores de la economía mundial, sin embargo, sería interesante investigar por país y dentro de cada país, cuanto están emitiendo, cuanto podrían dejar de emitir, o que se haga modelamiento matemático en base a los datos que se tienen o la realización de estimaciones. Todo suma en la preservación de nuestro planeta y en el asegurar la continuidad de la especie humana.

Dr. Jorge Luis Mírez Tarrillo
Group of Mathematical Modeling and Numerical Simulation (GMMNS).
Universidad Nacional de Ingeniería. Lima, Perú.
E-mail: jmirez@uni.edu.pe
Website Personal: https://jorgemirez2002.wixsite.com/jorgemirez
Facebook http://www.facebook.com/jorgemirezperu
Linkedin https://www.linkedin.com/in/jorge-luis-mirez-tarrillo-94918423/
Scopus ID: https://www.scopus.com/authid/detail.uri?authorId=56488109800
Google Scholar: https://scholar.google.com/citations?user=_dSpp4YAAAAJ
MATLAB Group Admin in Facebook: https://www.facebook.com/groups/Matlab.Simulink.for.All
WhatsApp Channel/Canal: https://whatsapp.com/channel/0029VbCvpZsAYlUSz2esek2y
Estimados lectores, según se muestra en el IEA World Energy Outlook 2024, que en la pasada década la participación de los combustibles fósiles en la energía global, ha caído un poco: del 82 % en el 2013 al 80 % en el 2023, de una energía global que sigue en crecimiento dado que la demanda en este mismo período se ha incremento un 15 %. Hay que tener en cuenta que en economías emergentes y en desarrollo, que agrupan al 85 % de la población mundial, la demanda de energía se ha incrementado en alrededor de 2.6 % por año en los últimos 10 años. En la figura se muestra la proyección hacia el 2025 segun tres escenarios: STEPS (escenario basado en las actuales políticas), APS (escenario de compromisos anunciados), y; NZE (escenario de cero emisiones netas al 2050). Se debe tener en cuenta, que la energía es parte de una industria, y esta parte de la economía local, regional, nacional y global, es decir, todos estos cambios se hacen considerando que economía progrese, no se estanque, a nivel micro y macro, desde el ciudadano a las naciones, desde los emprendedores hasta las grandes empresas.

Dr. Jorge Luis Mírez Tarrillo
Group of Mathematical Modeling and Numerical Simulation (GMMNS).
Universidad Nacional de Ingeniería. Lima, Perú.
E-mail: jmirez@uni.edu.pe
Website Personal: https://jorgemirez2002.wixsite.com/jorgemirez
Facebook http://www.facebook.com/jorgemirezperu
Linkedin https://www.linkedin.com/in/jorge-luis-mirez-tarrillo-94918423/
Scopus ID: https://www.scopus.com/authid/detail.uri?authorId=56488109800
Google Scholar: https://scholar.google.com/citations?user=_dSpp4YAAAAJ
MATLAB Group Admin in Facebook: https://www.facebook.com/groups/Matlab.Simulink.for.All
WhatsApp Channel/Canal: https://whatsapp.com/channel/0029VbCvpZsAYlUSz2esek2y
Sustainable Thermal Energy Storage Systems: A Mathematical Model of the “Waru-Waru” Agricultural Technique Used in Cold Environments
by Jorge Luis Mírez Tarrillo
Group of Mathematical Modeling and Numerical Simulation, Faculty of Oil, Natural Gas and Petrochemical Engineering, Universidad Nacional de Ingeniería, Av. Tupac Amaru 210, Rimac 15333, Peru
Energies 2025, 18(12), 3116; https://doi.org/10.3390/en18123116
Sitio web: https://www.mdpi.com/1996-1073/18/12/3116

Dr. Jorge Luis Mírez Tarrillo
Group of Mathematical Modeling and Numerical Simulation (GMMNS).
Universidad Nacional de Ingeniería. Lima, Perú.
E-mail: jmirez@uni.edu.pe
Website Personal: https://jorgemirez2002.wixsite.com/jorgemirez
Facebook http://www.facebook.com/jorgemirezperu
Linkedin https://www.linkedin.com/in/jorge-luis-mirez-tarrillo-94918423/
Scopus ID: https://www.scopus.com/authid/detail.uri?authorId=56488109800
Google Scholar: https://scholar.google.com/citations?user=_dSpp4YAAAAJ
MATLAB Group Admin in Facebook: https://www.facebook.com/groups/Matlab.Simulink.for.All
WhatsApp Channel/Canal: https://whatsapp.com/channel/0029VbCvpZsAYlUSz2esek2y
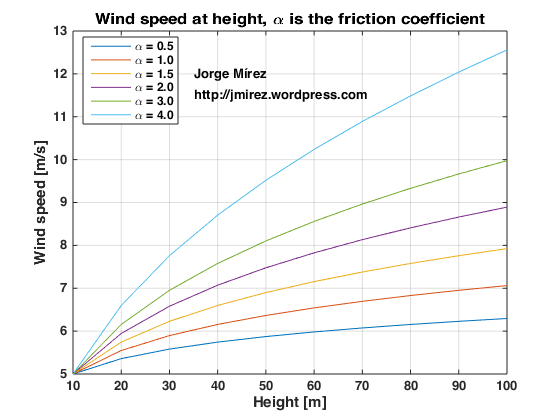
Wind speed will increase with the height because the friction at earth surface is large. The rate of the increase of wind speed that is often used to characterize the impact of the roughness of the earth’s surface on wind speed is given by the equation of this post, where v is the wind speed at height H, vo is the nominal wind speed at height Ho, and α is the friction coefficient. Made with MATLAB.

Dr. Jorge Luis Mírez Tarrillo
Group of Mathematical Modeling and Numerical Simulation (GMMNS).
Universidad Nacional de Ingeniería. Lima, Perú.
E-mail: jmirez@uni.edu.pe
Website Personal: https://jorgemirez2002.wixsite.com/jorgemirez
Facebook http://www.facebook.com/jorgemirezperu
Linkedin https://www.linkedin.com/in/jorge-luis-mirez-tarrillo-94918423/
Scopus ID: https://www.scopus.com/authid/detail.uri?authorId=56488109800
Google Scholar: https://scholar.google.com/citations?user=_dSpp4YAAAAJ
MATLAB Group Admin in Facebook: https://www.facebook.com/groups/Matlab.Simulink.for.All
WhatsApp Channel/Canal: https://whatsapp.com/channel/0029VbCvpZsAYlUSz2esek2y
Link de Paper en IEEExplore:
https://ieeexplore.ieee.org/document/9359432
DOI: 10.1109/ICMEAE51770.2020.00043
Abstract:
Structure perovskite cells, with the general formula ABX3 and named after the mineral CaTiO3 [1], become good candidates for use in converting solar energy into electrical energy, because their efficiency increased in a short period from an initial 3.8 % to laboratory-scale energy conversion efficiency of 23.3 %, which rivals the performance of commercial multi-crystalline silicon solar cells [2]. Recently the power conversion efficiency (PCE) has reached 24.2 %. In addition, another important merit is its production cost, screen printing [3], roll to roll printing [4]. Another characteristic of the carbon electrode is that, due to its composition, it can transport the holes and does not need a hole-transporter material (HTM) or hole-transporter layer (HTL), unlike peroskite cells with metal. In [19] a study is reported where the storage stability of 1 year and PCE of 10.4 % (AM 1.5G, 100 mW/cm was reached in an area of 49 cm2 of mesoscopic carbon perovskites (CSPC).
Regards:
Dr. Jorge Luis Mírez Tarrillo
Group of Mathematical Modeling and Numerical Simulation (GMMNS).
Universidad Nacional de Ingeniería. Lima, Perú.
E-mail: jmirez@uni.edu.pe
Website Personal: https://jorgemirez2002.wixsite.com/jorgemirez
Facebook http://www.facebook.com/jorgemirezperu
Linkedin https://www.linkedin.com/in/jorge-luis-mirez-tarrillo-94918423/
Scopus ID: https://www.scopus.com/authid/detail.uri?authorId=56488109800
Google Scholar: https://scholar.google.com/citations?user=_dSpp4YAAAAJ
MATLAB Group Admin in Facebook: https://www.facebook.com/groups/Matlab.Simulink.for.All
WhatsApp Channel/Canal: https://whatsapp.com/channel/0029VbCvpZsAYlUSz2esek2y
Determining the necessary area of photovoltaic solar panels to be able to feed a demand is something to evaluate considering that both the demand and the energy source (the Sun) vary in their behavior. The total solar cells area required to supply the load demand can be calculated from the following equation shown in the figure of this post where \F_{s} is the safety factor which includes the possible allowance of insolation data inaccuracy, \V_{F} is the factor of variability which considers the impact of yearly radiation variation. \P_{L} is the power demand, \H_{t} is the solar irradiation and \n_{c} is the efficiency of the photovoltaic solar panel.

Dr. Jorge Luis Mírez Tarrillo
Group of Mathematical Modeling and Numerical Simulation (GMMNS).
Universidad Nacional de Ingeniería. Lima, Perú.
E-mail: jmirez@uni.edu.pe
Website Personal: https://jorgemirez2002.wixsite.com/jorgemirez
Facebook http://www.facebook.com/jorgemirezperu
Linkedin https://www.linkedin.com/in/jorge-luis-mirez-tarrillo-94918423/
Scopus ID: https://www.scopus.com/authid/detail.uri?authorId=56488109800
Google Scholar: https://scholar.google.com/citations?user=_dSpp4YAAAAJ
MATLAB Group Admin in Facebook: https://www.facebook.com/groups/Matlab.Simulink.for.All
WhatsApp Channel/Canal: https://whatsapp.com/channel/0029VbCvpZsAYlUSz2esek2y
En el presente video modelamos la potencia de la turbina eólica considerando la variación del área de barrido y la velocidad del viento, además, densidad y coeficiente de potencia se toman como constantes. Hecho en Matlab y 100 % práctico. Invitados a inscribirse en mi canal y seguirme en mis redes sociales.
Dr. Jorge Luis Mírez Tarrillo
Group of Mathematical Modeling and Numerical Simulation (GMMNS).
Universidad Nacional de Ingeniería. Lima, Perú.
E-mail: jmirez@uni.edu.pe
Website Personal: https://jorgemirez2002.wixsite.com/jorgemirez
Facebook http://www.facebook.com/jorgemirezperu
Linkedin https://www.linkedin.com/in/jorge-luis-mirez-tarrillo-94918423/
Scopus ID: https://www.scopus.com/authid/detail.uri?authorId=56488109800
Google Scholar: https://scholar.google.com/citations?user=_dSpp4YAAAAJ
MATLAB Group Admin in Facebook: https://www.facebook.com/groups/Matlab.Simulink.for.All
WhatsApp Channel/Canal: https://whatsapp.com/channel/0029VbCvpZsAYlUSz2esek2y
Dear readers, in the large cities and interurban spaces increasingly populated by the increase in the world population, it will be possible in the near future – if it does not exist now – to be able to configure the electrical loads in sets of multi-nanogrids. and / or multi-microgrids. All of them can have their own storage or have a storage for all of them. The figure, shows that I have been able to model and simulate the behavior of the energy stored in a storage source that collects or supplies energy to all nanogrids and / or microgrids. Its importance lies in sharing the surpluses to supply those that lack energy. If there is surplus, then know how much value they can get. If there is a deficit between all of them, the energy purchase will be made. Here they enter to carve different types of technologies between power electronics, control and protection systems. Random behavior has been considered anyway, as it is what happens in real life. While this is all mathematical modeling and numerical simulation, real data can be added. I hope it is of interest to you and I leave my contact information at the signing of this post. Regards.

Dr. Jorge Luis Mírez Tarrillo
Group of Mathematical Modeling and Numerical Simulation (GMMNS).
Universidad Nacional de Ingeniería. Lima, Perú.
E-mail: jmirez@uni.edu.pe
Website Personal: https://jorgemirez2002.wixsite.com/jorgemirez
Facebook http://www.facebook.com/jorgemirezperu
Linkedin https://www.linkedin.com/in/jorge-luis-mirez-tarrillo-94918423/
Scopus ID: https://www.scopus.com/authid/detail.uri?authorId=56488109800
Google Scholar: https://scholar.google.com/citations?user=_dSpp4YAAAAJ
MATLAB Group Admin in Facebook: https://www.facebook.com/groups/Matlab.Simulink.for.All
WhatsApp Channel/Canal: https://whatsapp.com/channel/0029VbCvpZsAYlUSz2esek2y
Dear readers, I am grateful for the multiple visits each day to my different blogs. On the subject of renewable energies, there are concepts such as microgrids (a cell with the ability to connect and disconnect from the Public Electricity Grid (PEG) through a Common Coupling Point with a capacity of up to 10 MW) and nanogrids (a unit of Generally a small residential and / or commercial load equipped with renewable sources such as photovoltaic solar panels, wind turbines or others plus a storage system. Nanogrids and microgrids must work with other similar ones in a coordinated way and sharing resources that they have surplus to Some, transfer it to others. With this, in front of the PEG, the microgrids / nanogrids arrangements that we will call multi-nanogrids – multi-microgrids must present a global balance of excess or missing power of all. The image of this post shows an axis of states – to generalize – how the deficit and surplus of the power that houses the entire set of multi-nanogrids – mult i-microgrids. I hope it is of interest to you and I leave my contact information at the signing of this post. Regards.

Dr. Jorge Luis Mírez Tarrillo
Group of Mathematical Modeling and Numerical Simulation (GMMNS).
Universidad Nacional de Ingeniería. Lima, Perú.
E-mail: jmirez@uni.edu.pe
Website Personal: https://jorgemirez2002.wixsite.com/jorgemirez
Facebook http://www.facebook.com/jorgemirezperu
Linkedin https://www.linkedin.com/in/jorge-luis-mirez-tarrillo-94918423/
Scopus ID: https://www.scopus.com/authid/detail.uri?authorId=56488109800
Google Scholar: https://scholar.google.com/citations?user=_dSpp4YAAAAJ
MATLAB Group Admin in Facebook: https://www.facebook.com/groups/Matlab.Simulink.for.All
WhatsApp Channel/Canal: https://whatsapp.com/channel/0029VbCvpZsAYlUSz2esek2y

Regards time, the ultimate consumer burns a fuel whose chemical composition varies, see Figure. These variations bring problems for plant operation, whatever is the prime mover (Internal Combustion engine, gas turbine or boiler).
Methane number (MN) characterizes gaseous fuel tendency to auto-ignition. By convention, this index has a value 100 for methane and 0 for hydrogen (Leiker et al., 1972). The gaseous fuels are thus compared with a methane-hydrogen binary mixture. Two gases with same value MN have the same resistance against the spontaneous combustion.
Source:
Natural Gas : Physical Properties and Combustion Features.
By Olivier Le Corre and Khaled Loubar
Dr. Jorge Luis Mírez Tarrillo
Group of Mathematical Modeling and Numerical Simulation (GMMNS).
Universidad Nacional de Ingeniería. Lima, Perú.
E-mail: jmirez@uni.edu.pe
Website Personal: https://jorgemirez2002.wixsite.com/jorgemirez
Facebook http://www.facebook.com/jorgemirezperu
Linkedin https://www.linkedin.com/in/jorge-luis-mirez-tarrillo-94918423/
Scopus ID: https://www.scopus.com/authid/detail.uri?authorId=56488109800
Google Scholar: https://scholar.google.com/citations?user=_dSpp4YAAAAJ
MATLAB Group Admin in Facebook: https://www.facebook.com/groups/Matlab.Simulink.for.All
WhatsApp Channel/Canal: https://whatsapp.com/channel/0029VbCvpZsAYlUSz2esek2y
Offshore wind has emerged as one of the most dynamic technologies in the energy system. For the first time in 2010 global capacity additions of offshore wind surpassed 1 gigawatt (GW). In 2018, a total of 4.3 GW of new offshore wind capacity was completed (see Figure). From 3 GW of offshore wind in operation in 2010, installed capacity expanded to
23 GW in 2018. Annual deployment has increased by nearly 30 % per year, higher than any other source of electricity except solar photovoltaics (PV). By mid-2019, there were over 5,500 offshore turbines connected to a grid in 17 countries. Policy support has been fundamental to this expansion, including through technology-specific capacity tenders, progress on including offshore wind in marine planning, financial support and regulatory efforts to support grid development.
The growth of the offshore wind industry has been fostered in European countries bordering the North Seas, where high quality wind resources and relatively shallow water have provided exceptionally good conditions in which to develop offshore wind technologies and bring them to market. Stable policies supported nearly 17 GW of offshore
wind capacity additions in Europe between 2010 and 2018. The United Kingdom, Germany, Belgium, Netherlands and Denmark together added 2.7 GW of capacity in 2018 alone. China has recently taken strides forward on offshore wind and now stands among the market leaders. In 2018, China added 1.6 GW of offshore wind capacity, the most of any
country. This rapid growth has been driven by the government’s 13th Five-Year Plan, which called for 5 GW of offshore wind capacity to be completed by 2020, and for the establishment of supply chains to support further expansion thereafter.

Source: IEA Offshore Wind Outlook 2019 https://www.iea.org/
Regards:
Dr. Jorge Luis Mírez Tarrillo
Group of Mathematical Modeling and Numerical Simulation (GMMNS).
Universidad Nacional de Ingeniería. Lima, Perú.
E-mail: jmirez@uni.edu.pe
Website Personal: https://jorgemirez2002.wixsite.com/jorgemirez
Facebook http://www.facebook.com/jorgemirezperu
Linkedin https://www.linkedin.com/in/jorge-luis-mirez-tarrillo-94918423/
Scopus ID: https://www.scopus.com/authid/detail.uri?authorId=56488109800
Google Scholar: https://scholar.google.com/citations?user=_dSpp4YAAAAJ
MATLAB Group Admin in Facebook: https://www.facebook.com/groups/Matlab.Simulink.for.All
WhatsApp Channel/Canal: https://whatsapp.com/channel/0029VbCvpZsAYlUSz2esek2y

As a wind turbine generator, a permanent magnet synchronous generator (PMSG) is used in this post. Mechanical energy is acquired from the kinetic energy of the wind through a wind turbine, and the PMSG converts this energy to electrical energy. The PMSG output is converted to DC power through a thyristor rectifier. The output power of the wind turbine is equal to the DC converted power if the losses in the generator and rectifier are negligible.
Referencia: S. M. Muyeen “Wind Energy Conversion Systems – Technology and Trends” Springer. New York. DOI 10.1007/978-1-4471-2201-2
Regards:
Dr. Jorge Luis Mírez Tarrillo
Group of Mathematical Modeling and Numerical Simulation (GMMNS).
Universidad Nacional de Ingeniería. Lima, Perú.
E-mail: jmirez@uni.edu.pe
Website Personal: https://jorgemirez2002.wixsite.com/jorgemirez
Facebook http://www.facebook.com/jorgemirezperu
Linkedin https://www.linkedin.com/in/jorge-luis-mirez-tarrillo-94918423/
Scopus ID: https://www.scopus.com/authid/detail.uri?authorId=56488109800
Google Scholar: https://scholar.google.com/citations?user=_dSpp4YAAAAJ
MATLAB Group Admin in Facebook: https://www.facebook.com/groups/Matlab.Simulink.for.All
WhatsApp Channel/Canal: https://whatsapp.com/channel/0029VbCvpZsAYlUSz2esek2y
«A mathematical model of SmartValley for estimation of contribution of biomass to the electrical generation»
Jorge Mírez ; Segundo Horna ; Daniel Carranza
2019 IEEE International Autumn Meeting on Power, Electronics and Computing (ROPEC). Ixtapa, Mexico, Mexico
Abstract:
A mathematical model is presented for the estimation of the contribution of biomass to the generation of electricity for a valley as a geographical scope of application. Is considered that a valley has several species that are cultivated during the year and that have by-products of the harvest that we have considered as biomass that can be used for the production of electricity that would benefit the valley’s inhabiting community. We have called this integration between population and crops SmartValley, which leads to the use of monitoring, control, management and planning among the different agricultural-energy actors.
Link: https://ieeexplore.ieee.org/document/9057045
Gratefully for this news !!
Regards:
Dr. Jorge Luis Mírez Tarrillo – PERU
Facebook http://www.facebook.com/jorgemirezperu
Linkedin https://www.linkedin.com/in/jorge-luis-mirez-tarrillo-94918423/
E-mail: jmirez@uni.edu.pe
Dr. Jorge Luis Mírez Tarrillo
Group of Mathematical Modeling and Numerical Simulation (GMMNS).
Universidad Nacional de Ingeniería. Lima, Perú.
E-mail: jmirez@uni.edu.pe
Website Personal: https://jorgemirez2002.wixsite.com/jorgemirez
Facebook http://www.facebook.com/jorgemirezperu
Linkedin https://www.linkedin.com/in/jorge-luis-mirez-tarrillo-94918423/
Scopus ID: https://www.scopus.com/authid/detail.uri?authorId=56488109800
Google Scholar: https://scholar.google.com/citations?user=_dSpp4YAAAAJ
MATLAB Group Admin in Facebook: https://www.facebook.com/groups/Matlab.Simulink.for.All
WhatsApp Channel/Canal: https://whatsapp.com/channel/0029VbCvpZsAYlUSz2esek2y
 Source: Alan K. Burnham. “Global Chemical Kinetics of Fossil Fuels Alan K. Burnham – How to Model Maturation and Pyrolysis”. Springer. 2017.
Dr. Jorge Luis Mírez Tarrillo
Group of Mathematical Modeling and Numerical Simulation (GMMNS).
Universidad Nacional de Ingeniería. Lima, Perú.
E-mail: jmirez@uni.edu.pe
Website Personal: https://jorgemirez2002.wixsite.com/jorgemirez
Facebook http://www.facebook.com/jorgemirezperu
Linkedin https://www.linkedin.com/in/jorge-luis-mirez-tarrillo-94918423/
Scopus ID: https://www.scopus.com/authid/detail.uri?authorId=56488109800
Google Scholar: https://scholar.google.com/citations?user=_dSpp4YAAAAJ
MATLAB Group Admin in Facebook: https://www.facebook.com/groups/Matlab.Simulink.for.All
WhatsApp Channel/Canal: https://whatsapp.com/channel/0029VbCvpZsAYlUSz2esek2y
Source: Alan K. Burnham. “Global Chemical Kinetics of Fossil Fuels Alan K. Burnham – How to Model Maturation and Pyrolysis”. Springer. 2017.
Dr. Jorge Luis Mírez Tarrillo
Group of Mathematical Modeling and Numerical Simulation (GMMNS).
Universidad Nacional de Ingeniería. Lima, Perú.
E-mail: jmirez@uni.edu.pe
Website Personal: https://jorgemirez2002.wixsite.com/jorgemirez
Facebook http://www.facebook.com/jorgemirezperu
Linkedin https://www.linkedin.com/in/jorge-luis-mirez-tarrillo-94918423/
Scopus ID: https://www.scopus.com/authid/detail.uri?authorId=56488109800
Google Scholar: https://scholar.google.com/citations?user=_dSpp4YAAAAJ
MATLAB Group Admin in Facebook: https://www.facebook.com/groups/Matlab.Simulink.for.All
WhatsApp Channel/Canal: https://whatsapp.com/channel/0029VbCvpZsAYlUSz2esek2y
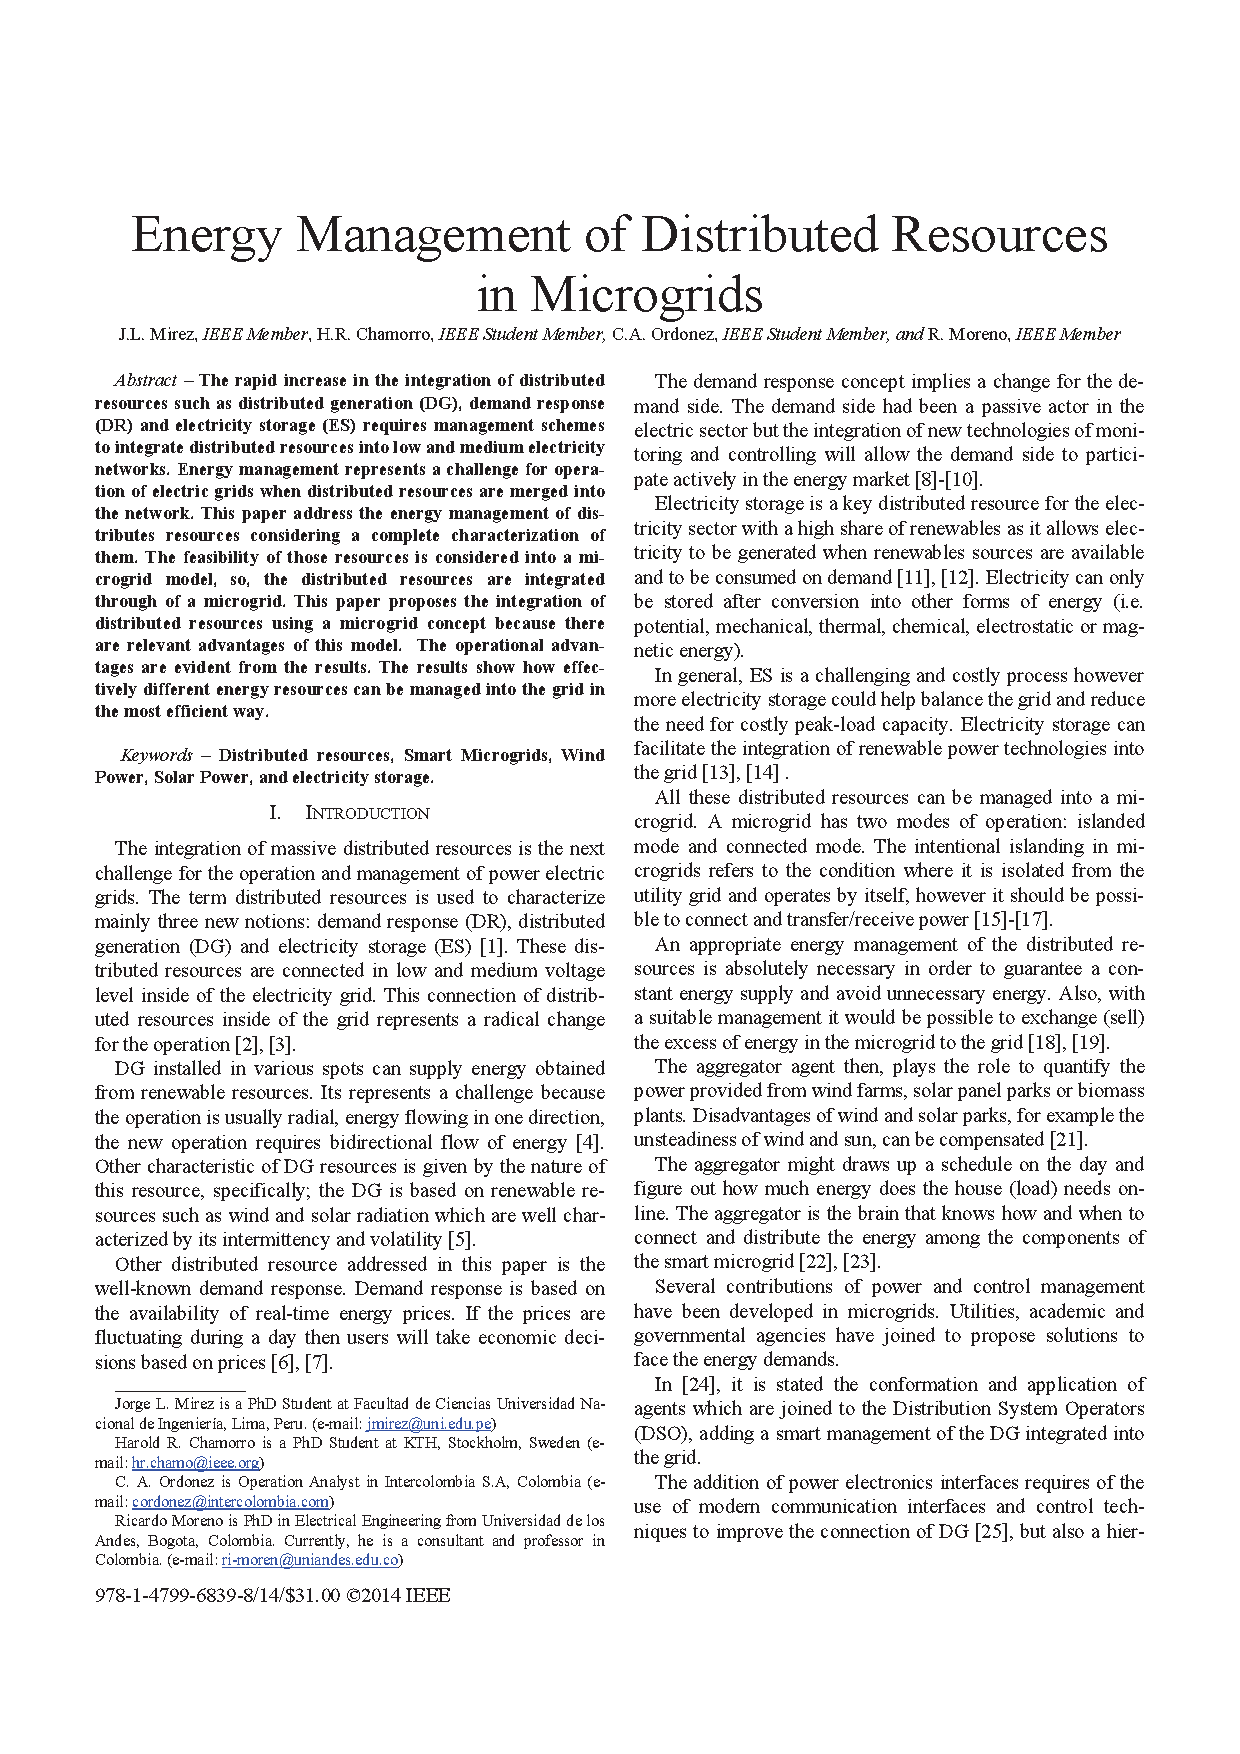
«Energy Management of Distributed Resources in Microgrids». J. L. Mírez, H.R. Chamorro, C.A. Ordonez, R. Moreno. 2014 IEEE 5th Colombian Workshop on Circuits and Systems (CWCAS).
DOI: 10.1109/CWCAS.2014.6994607
Dr. Jorge Luis Mírez Tarrillo
Group of Mathematical Modeling and Numerical Simulation (GMMNS).
Universidad Nacional de Ingeniería. Lima, Perú.
E-mail: jmirez@uni.edu.pe
Website Personal: https://jorgemirez2002.wixsite.com/jorgemirez
Facebook http://www.facebook.com/jorgemirezperu
Linkedin https://www.linkedin.com/in/jorge-luis-mirez-tarrillo-94918423/
Scopus ID: https://www.scopus.com/authid/detail.uri?authorId=56488109800
Google Scholar: https://scholar.google.com/citations?user=_dSpp4YAAAAJ
MATLAB Group Admin in Facebook: https://www.facebook.com/groups/Matlab.Simulink.for.All
WhatsApp Channel/Canal: https://whatsapp.com/channel/0029VbCvpZsAYlUSz2esek2y
«Simulation of DC Microgrid and Study of Power and Battery Charge/Discharge Management». Jorge Mírez, Luis Hernández-Callejo, Manfred Horn, Luis Miguel Bonilla. DYNA Ingeniería e Industrial. November 2017 – Volume: 92 – Pages: 673-679.
DOI: http://dx.doi.org/10.6036/8475

Dr. Jorge Luis Mírez Tarrillo
Group of Mathematical Modeling and Numerical Simulation (GMMNS).
Universidad Nacional de Ingeniería. Lima, Perú.
E-mail: jmirez@uni.edu.pe
Website Personal: https://jorgemirez2002.wixsite.com/jorgemirez
Facebook http://www.facebook.com/jorgemirezperu
Linkedin https://www.linkedin.com/in/jorge-luis-mirez-tarrillo-94918423/
Scopus ID: https://www.scopus.com/authid/detail.uri?authorId=56488109800
Google Scholar: https://scholar.google.com/citations?user=_dSpp4YAAAAJ
MATLAB Group Admin in Facebook: https://www.facebook.com/groups/Matlab.Simulink.for.All
WhatsApp Channel/Canal: https://whatsapp.com/channel/0029VbCvpZsAYlUSz2esek2y
«A modeling and simulation of optimized interconnection between DC microgrids with novel strategies of voltage, power and control». Jorge Mírez. 2017 IEEE Second International Conference on DC Microgrids (ICDCM). DOI: 10.1109/ICDCM.2017.8001098

Dr. Jorge Luis Mírez Tarrillo
Group of Mathematical Modeling and Numerical Simulation (GMMNS).
Universidad Nacional de Ingeniería. Lima, Perú.
E-mail: jmirez@uni.edu.pe
Website Personal: https://jorgemirez2002.wixsite.com/jorgemirez
Facebook http://www.facebook.com/jorgemirezperu
Linkedin https://www.linkedin.com/in/jorge-luis-mirez-tarrillo-94918423/
Scopus ID: https://www.scopus.com/authid/detail.uri?authorId=56488109800
Google Scholar: https://scholar.google.com/citations?user=_dSpp4YAAAAJ
MATLAB Group Admin in Facebook: https://www.facebook.com/groups/Matlab.Simulink.for.All
WhatsApp Channel/Canal: https://whatsapp.com/channel/0029VbCvpZsAYlUSz2esek2y
«Technical-Economic Analysis of a AC/DC Microgrid for Public Health Institutions with Low Electrical Demand. Case Study: Perú». Jorge Luis Mírez Tarrillo. Perfiles. Number 16. Vol. 2 (2016). ISSN 1390-5740.
http://ceaa.espoch.edu.ec:8080/revista.perfiles/Articuloshtml/Perfiles16Art7/Perfiles16Art7.xhtml
Dr. Jorge Luis Mírez Tarrillo
Group of Mathematical Modeling and Numerical Simulation (GMMNS).
Universidad Nacional de Ingeniería. Lima, Perú.
E-mail: jmirez@uni.edu.pe
Website Personal: https://jorgemirez2002.wixsite.com/jorgemirez
Facebook http://www.facebook.com/jorgemirezperu
Linkedin https://www.linkedin.com/in/jorge-luis-mirez-tarrillo-94918423/
Scopus ID: https://www.scopus.com/authid/detail.uri?authorId=56488109800
Google Scholar: https://scholar.google.com/citations?user=_dSpp4YAAAAJ
MATLAB Group Admin in Facebook: https://www.facebook.com/groups/Matlab.Simulink.for.All
WhatsApp Channel/Canal: https://whatsapp.com/channel/0029VbCvpZsAYlUSz2esek2y

«Dissolved Ion Movement and Regulation of pH in a Watery Substance under a Constant Magnetic Field». Jorge L. Mírez Tarrillo, José Joaquín Tristá Moncada. Tecnología Química. Special Edition – 2001. ISSN 0041-8420. Cuba. https://revistas.uo.edu.cu/index.php/tq/index

Dr. Jorge Luis Mírez Tarrillo
Group of Mathematical Modeling and Numerical Simulation (GMMNS).
Universidad Nacional de Ingeniería. Lima, Perú.
E-mail: jmirez@uni.edu.pe
Website Personal: https://jorgemirez2002.wixsite.com/jorgemirez
Facebook http://www.facebook.com/jorgemirezperu
Linkedin https://www.linkedin.com/in/jorge-luis-mirez-tarrillo-94918423/
Scopus ID: https://www.scopus.com/authid/detail.uri?authorId=56488109800
Google Scholar: https://scholar.google.com/citations?user=_dSpp4YAAAAJ
MATLAB Group Admin in Facebook: https://www.facebook.com/groups/Matlab.Simulink.for.All
WhatsApp Channel/Canal: https://whatsapp.com/channel/0029VbCvpZsAYlUSz2esek2y
Blog in ENGLISH

Compra/Buy – Haz una donación/Make a donation

Dear reader, if you wish to make a donation or are interested in any information or code, please contact me (e-mail: jmirez@uni.edu.pe). Donations will allow you to continue studying and researching, and also to provide more information on this blog. My PayPal account is jorgemirez2002@gmail.com or if it is by bank transfer write to my email jmirez@uni.edu.pe. Any amount of money is welcome. Thank you.
Estimado lector, si desean hacer una donación o le interesa alguna información o código, favor ponerse en contacto con mi persona (e-mail: jmirez@uni.edu.pe). Las donaciones va a permitir seguir estudiando e investigando, y además, el poder brindar más información en este blog. Mi cuenta en PayPal es jorgemirez2002@gmail.com o si es por transferencia bancaria escribirme a mi correo jmirez@uni.edu.pe. Cualquier cantidad de dinero es bienvenido. Gracias.
Datos Generales
Good day. My full name is Jorge Luis MIREZ TARRILLO.
I am Peruvian and live in Lima, capital of Perú in South America.I am Mechanical Electrical Engineering, MSc Physics and Dr. Physics (title doctoral thesis: Control, Optimization, and Management of Microgrid Current Direct)
Too, actually job as Principal Professor in Faculty of Oil, Gas and Petrochemical Engineering of Universidad Nacional de Ingeniería (National University of Engineering) in Lima – PERU (Courses: Modern Physics, Differential Equations and Research's Methodology)
My subjects of my interest are control, signal processing, optimization, simulation, biomedical research, smart grid, microgrid, water.
I have experience in Matlab/Simulink programming, biomedical equipment, electrical systems, renewable energies, microgrids, saturated steam systems 100 psi and organizing academic events.
Comentarios Recientes
Elementos que compon… en J506: Los elementos de un paqu… Dr. Jorge Mírez en Message by IEEE Community Dr. Jorge Mírez en J546: Simulación de campos mag… jose luis huayanay v… en Message by IEEE Community Cesar Aviles en J546: Simulación de campos mag… Dr. Jorge Mírez en J518: La herramienta pdetool d… Dr. Jorge Mírez en J496: Simulación en Matlab/Sim… Raúl Barrios Elizarr… en J496: Simulación en Matlab/Sim… jose luis huayanay v… en J518: La herramienta pdetool d… MSc. Jorge Mírez en J281: La Rosa de Vientos: Frec…
Debe estar conectado para enviar un comentario.