Archive for the ‘Aerogenerador’ Category
Estimados lectores. Las energías renovables son el tema de interés e incluye tecnologías como las turbinas eólicas. En el presente post les comparto una gráfica que representa como cambia el coeficiente de potencia según el TSR para una turbina de viento. El TSR que es influido por la velocidad del viento y la velocidad de rotación de la turbina cambia constantemente y he ahí el arte del sistema de control apoyado en la inercia de la turbina para mantener las condiciones más apropiadas para la transformación de la energía mecánica a eléctrica. Espero les sea interesante.
Dear readers. Renewable energy is a topic of great interest and includes technologies such as wind turbines. In this post, I’m sharing a graph that illustrates how the power coefficient changes as a function of the tip speed ratio (TSR) for a wind turbine. The TSR, which is influenced by wind speed and the turbine’s rotational speed, changes constantly, and therein lies the art of the control system—which relies on the turbine’s inertia to maintain the most appropriate conditions for converting mechanical energy into electrical energy. I hope you find this interesting.

Dr. Jorge Luis Mírez Tarrillo
Group of Mathematical Modeling and Numerical Simulation (GMMNS).
Universidad Nacional de Ingeniería. Lima, Perú.
E-mail: jmirez@uni.edu.pe
Website Personal: https://jorgemirez2002.wixsite.com/jorgemirez
Facebook http://www.facebook.com/jorgemirezperu
Linkedin https://www.linkedin.com/in/jorge-luis-mirez-tarrillo-94918423/
Scopus ID: https://www.scopus.com/authid/detail.uri?authorId=56488109800
Google Scholar: https://scholar.google.com/citations?user=_dSpp4YAAAAJ
MATLAB Group Admin in Facebook: https://www.facebook.com/groups/Matlab.Simulink.for.All
WhatsApp Channel/Canal: https://whatsapp.com/channel/0029VbCvpZsAYlUSz2esek2y
J1162: Libro «Evolución de los sistemas energéticos en Iberoamérica». Link para leer y descargar PDF
Les invito a consultar el libro «Evolución de los sistemas energéticos en Iberoamérica» en el cual se explora la evolución y estado actual de los sistemas de energía en España, Argentina, Colombia, Cuba, México, Paraguay, Puerto Rico, Ecuador, El Salvador, Uruguay, Panamá, Honduras, República Dominicana, Venezuela, Perú, Costa Rica, Bolivia, Brasil y Guatemala. Los trabajos que conforman el libro son contribuciones de los miembros de la Red RIBIERSE-CYTED – Red para la integración a gran escala de energías renovables en los sistemas eléctricos; cuyo objetivo es promover la descarbonización del sector eléctrico gracias a la integración de fuentes renovables en los sistemas eléctricos y su hibridación con sistemas de almacenamiento y la ‘E-Mobility’. https://zenodo.org/records/15602611

Dr. Jorge Luis Mírez Tarrillo
Group of Mathematical Modeling and Numerical Simulation (GMMNS).
Universidad Nacional de Ingeniería. Lima, Perú.
E-mail: jmirez@uni.edu.pe
Website Personal: https://jorgemirez2002.wixsite.com/jorgemirez
Facebook http://www.facebook.com/jorgemirezperu
Linkedin https://www.linkedin.com/in/jorge-luis-mirez-tarrillo-94918423/
Scopus ID: https://www.scopus.com/authid/detail.uri?authorId=56488109800
Google Scholar: https://scholar.google.com/citations?user=_dSpp4YAAAAJ
MATLAB Group Admin in Facebook: https://www.facebook.com/groups/Matlab.Simulink.for.All
WhatsApp Channel/Canal: https://whatsapp.com/channel/0029VbCvpZsAYlUSz2esek2y
Estimados lectores, retomando los temas de energías renovables y redes eléctricas avanzadas, les muestro acá una simulación de las pérdidas dieléctricas de cable (conductor de electricidad) cuya fórmula también se muestra en la figura. La figura muestra un comportamiento causi-real en que todos los parámetros cambian: la frecuencia, el voltaje y el factor de pérdidas del aislamiento. En éste caso, sólo cambian la frecuencia y el factor de pérdidas de aislamiento. El tiempo es referencial. Hecho en MATLAB/Simulink de MathWorks Inc.

Dr. Jorge Luis Mírez Tarrillo
Group of Mathematical Modeling and Numerical Simulation (GMMNS).
Universidad Nacional de Ingeniería. Lima, Perú.
E-mail: jmirez@uni.edu.pe
Website Personal: https://jorgemirez2002.wixsite.com/jorgemirez
Facebook http://www.facebook.com/jorgemirezperu
Linkedin https://www.linkedin.com/in/jorge-luis-mirez-tarrillo-94918423/
Scopus ID: https://www.scopus.com/authid/detail.uri?authorId=56488109800
Google Scholar: https://scholar.google.com/citations?user=_dSpp4YAAAAJ
MATLAB Group Admin in Facebook: https://www.facebook.com/groups/Matlab.Simulink.for.All
WhatsApp Channel/Canal: https://whatsapp.com/channel/0029VbCvpZsAYlUSz2esek2y
Tarrillo, Jorge Luis Mírez, and Jesús C. Hernandez. 2024. «Proposal for the Implementation of Solar Chimneys near Urban Environments with Variable Collector Area According to Demand and Environmental Conditions» Energies 17, no. 20: 5039
Website: https://www.mdpi.com/1996-1073/17/20/5039

Dr. Jorge Luis Mírez Tarrillo
Group of Mathematical Modeling and Numerical Simulation (GMMNS).
Universidad Nacional de Ingeniería. Lima, Perú.
E-mail: jmirez@uni.edu.pe
Website Personal: https://jorgemirez2002.wixsite.com/jorgemirez
Facebook http://www.facebook.com/jorgemirezperu
Linkedin https://www.linkedin.com/in/jorge-luis-mirez-tarrillo-94918423/
Scopus ID: https://www.scopus.com/authid/detail.uri?authorId=56488109800
Google Scholar: https://scholar.google.com/citations?user=_dSpp4YAAAAJ
MATLAB Group Admin in Facebook: https://www.facebook.com/groups/Matlab.Simulink.for.All
WhatsApp Channel/Canal: https://whatsapp.com/channel/0029VbCvpZsAYlUSz2esek2y
En el mundo de las energías renovables, las microrredes surgen como elementos organizativos de diferentes fuentes y cargas ubicados dentro de un espacio geográfico delimitado y con uno o más puntos de interconexión sea con otra microrred o con la red eléctrica pública. Paneles solares fotovoltaicos, turbinass eólicas, almacenamiento electroquímico, etc. son parte de sus componentes. La demanda igualmente puede ser residencial, comercial o industrial. Todo esto crea comportamiento de la demanda que es atendido por la oferta y en algún momento pueda haber déficil o sobrante. La figura del presente post muestra un ejemplo acerca de ello, en que tres microrredes debido a sus comportamientos propios, presentan diferente necesidad y sobrante en el tiempo. Hecho con MATLAB.

Dr. Jorge Luis Mírez Tarrillo
Group of Mathematical Modeling and Numerical Simulation (GMMNS).
Universidad Nacional de Ingeniería. Lima, Perú.
E-mail: jmirez@uni.edu.pe
Website Personal: https://jorgemirez2002.wixsite.com/jorgemirez
Facebook http://www.facebook.com/jorgemirezperu
Linkedin https://www.linkedin.com/in/jorge-luis-mirez-tarrillo-94918423/
Scopus ID: https://www.scopus.com/authid/detail.uri?authorId=56488109800
Google Scholar: https://scholar.google.com/citations?user=_dSpp4YAAAAJ
MATLAB Group Admin in Facebook: https://www.facebook.com/groups/Matlab.Simulink.for.All
WhatsApp Channel/Canal: https://whatsapp.com/channel/0029VbCvpZsAYlUSz2esek2y
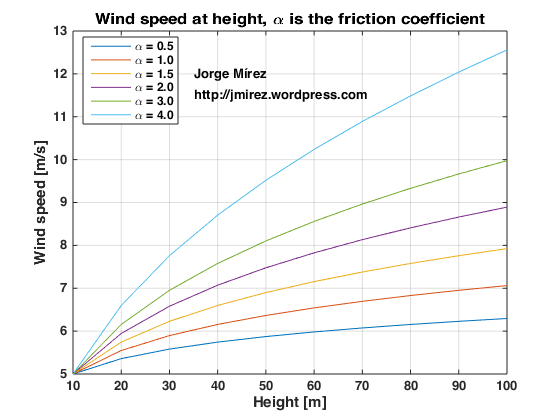
Wind speed will increase with the height because the friction at earth surface is large. The rate of the increase of wind speed that is often used to characterize the impact of the roughness of the earth’s surface on wind speed is given by the equation of this post, where v is the wind speed at height H, vo is the nominal wind speed at height Ho, and α is the friction coefficient. Made with MATLAB.

Dr. Jorge Luis Mírez Tarrillo
Group of Mathematical Modeling and Numerical Simulation (GMMNS).
Universidad Nacional de Ingeniería. Lima, Perú.
E-mail: jmirez@uni.edu.pe
Website Personal: https://jorgemirez2002.wixsite.com/jorgemirez
Facebook http://www.facebook.com/jorgemirezperu
Linkedin https://www.linkedin.com/in/jorge-luis-mirez-tarrillo-94918423/
Scopus ID: https://www.scopus.com/authid/detail.uri?authorId=56488109800
Google Scholar: https://scholar.google.com/citations?user=_dSpp4YAAAAJ
MATLAB Group Admin in Facebook: https://www.facebook.com/groups/Matlab.Simulink.for.All
WhatsApp Channel/Canal: https://whatsapp.com/channel/0029VbCvpZsAYlUSz2esek2y
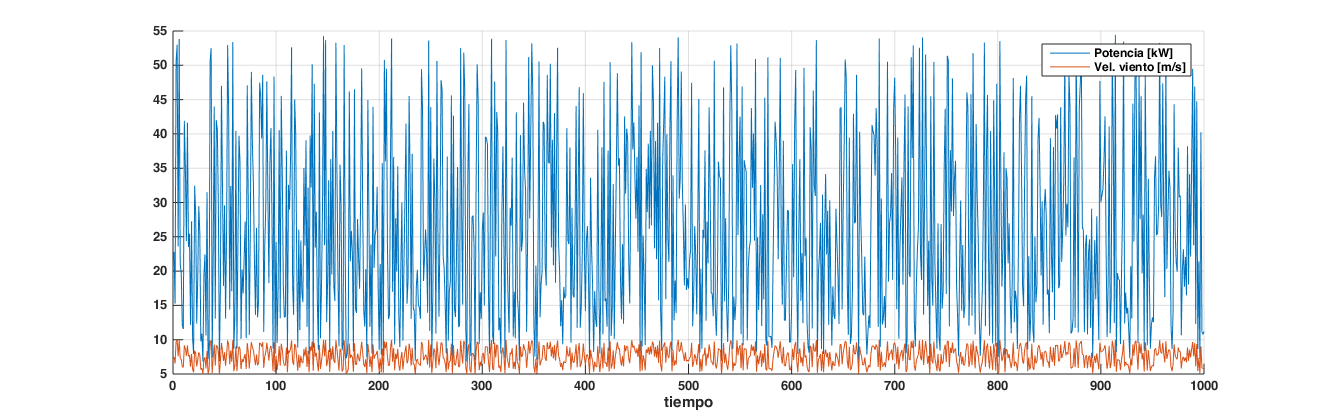
Estimados lectores, y resulta que una de las cosas más interesantes es acercarse hacia las condiciones reales de velocidad de viento y de potencia, sea para la valorización energética sino para también probar los sistemas de respaldo y de control ante escenarios recreados en computadora. La gráfica desarrollado muestra las variaciones de velocidad de viento y de potencia. Hecho en MATLAB, en el que detrás hay obviamente matemáticos con generación de números aleatorios entre 4 m/s a 15 m/s., Sólo está contemplado una turbina con densidad de aire y coeficiente de potencia constante, pero se puede recrear escenarios más reales. Bienvenido el apoyo y colaboración para seguir investigando y publicando.
Dr. Jorge Luis Mírez Tarrillo
Group of Mathematical Modeling and Numerical Simulation (GMMNS).
Universidad Nacional de Ingeniería. Lima, Perú.
E-mail: jmirez@uni.edu.pe
Website Personal: https://jorgemirez2002.wixsite.com/jorgemirez
Facebook http://www.facebook.com/jorgemirezperu
Linkedin https://www.linkedin.com/in/jorge-luis-mirez-tarrillo-94918423/
Scopus ID: https://www.scopus.com/authid/detail.uri?authorId=56488109800
Google Scholar: https://scholar.google.com/citations?user=_dSpp4YAAAAJ
MATLAB Group Admin in Facebook: https://www.facebook.com/groups/Matlab.Simulink.for.All
WhatsApp Channel/Canal: https://whatsapp.com/channel/0029VbCvpZsAYlUSz2esek2y
Estimados lectores, lo que considero relevante es al admirar el plano es ver que el punto que marca la potencia ideal de una turbina eólica realizaría una trayectoria sobre esa superficie que en éste caso toma constante el valor de la densidad y del coeficiente de potencia. Hecho en MATLAB. Bienvenido todo apoyo y colaboración para continuar investigando.

Dr. Jorge Luis Mírez Tarrillo
Group of Mathematical Modeling and Numerical Simulation (GMMNS).
Universidad Nacional de Ingeniería. Lima, Perú.
E-mail: jmirez@uni.edu.pe
Website Personal: https://jorgemirez2002.wixsite.com/jorgemirez
Facebook http://www.facebook.com/jorgemirezperu
Linkedin https://www.linkedin.com/in/jorge-luis-mirez-tarrillo-94918423/
Scopus ID: https://www.scopus.com/authid/detail.uri?authorId=56488109800
Google Scholar: https://scholar.google.com/citations?user=_dSpp4YAAAAJ
MATLAB Group Admin in Facebook: https://www.facebook.com/groups/Matlab.Simulink.for.All
WhatsApp Channel/Canal: https://whatsapp.com/channel/0029VbCvpZsAYlUSz2esek2y
Todo artefacto, componente, máquina, sistema, etc… presenta un progresivo envejecimiento que conlleva a la falla de los equipos los cuales se van registrando durante los años de funcionamiento y con esa información se crea histogramas como el que se muestra en el presente post. Obviamente mientras más fallas se presentan la curva de distribución se forma mejor, y a partir de ello se puede normalizar y tener una función de probabilidad característica de la marca y modelo del equipo, máquina, etc. Elaborado con MATLAB para ustedes queda la gráfica.

Dr. Jorge Luis Mírez Tarrillo
Group of Mathematical Modeling and Numerical Simulation (GMMNS).
Universidad Nacional de Ingeniería. Lima, Perú.
E-mail: jmirez@uni.edu.pe
Website Personal: https://jorgemirez2002.wixsite.com/jorgemirez
Facebook http://www.facebook.com/jorgemirezperu
Linkedin https://www.linkedin.com/in/jorge-luis-mirez-tarrillo-94918423/
Scopus ID: https://www.scopus.com/authid/detail.uri?authorId=56488109800
Google Scholar: https://scholar.google.com/citations?user=_dSpp4YAAAAJ
MATLAB Group Admin in Facebook: https://www.facebook.com/groups/Matlab.Simulink.for.All
WhatsApp Channel/Canal: https://whatsapp.com/channel/0029VbCvpZsAYlUSz2esek2y
Invitación a participar del Webinar: Microrredes Eléctricas. Expositor: Dr. Jorge Mírez. Jueves 30 de Marzo 2023. Hora: 16:00 horas México (17:00 horas Lima)
Link de Registro Expo Energía México 2023:
https://www.expoenergia.com.mx/Webinar/index.php

Dr. Jorge Luis Mírez Tarrillo
Group of Mathematical Modeling and Numerical Simulation (GMMNS).
Universidad Nacional de Ingeniería. Lima, Perú.
E-mail: jmirez@uni.edu.pe
Website Personal: https://jorgemirez2002.wixsite.com/jorgemirez
Facebook http://www.facebook.com/jorgemirezperu
Linkedin https://www.linkedin.com/in/jorge-luis-mirez-tarrillo-94918423/
Scopus ID: https://www.scopus.com/authid/detail.uri?authorId=56488109800
Google Scholar: https://scholar.google.com/citations?user=_dSpp4YAAAAJ
MATLAB Group Admin in Facebook: https://www.facebook.com/groups/Matlab.Simulink.for.All
WhatsApp Channel/Canal: https://whatsapp.com/channel/0029VbCvpZsAYlUSz2esek2y
Link in IEEExplore: https://ieeexplore.ieee.org/document/9140175
DOI: 10.1109/ICMEAE.2019.00034
Abstract:
This article includes a compilation and analysis of relevant information on the state of the art of the implementation of the Droop Control technique in microgrids. To this end, a summary and compilation of the theoretical models of the Droop Control and a summary of implementations have been made and, in general, try to summarize the great variety of experiences developed in this topic. The chosen experiences have been selected according to the research motivations that are available in the future and that are explained throughout this article, since this will serve as a starting point and guide for future research in microgrids and similar novel topics such as Low Voltage Distribution in Direct Current (LV DC) and DC microgrids (DC MG). The LV DC distribution for this article is related to houses in direct current (DC Home).
Gratefully for this news !!
Regards:
Dr. Jorge Luis Mírez Tarrillo
Group of Mathematical Modeling and Numerical Simulation (GMMNS).
Universidad Nacional de Ingeniería. Lima, Perú.
E-mail: jmirez@uni.edu.pe
Website Personal: https://jorgemirez2002.wixsite.com/jorgemirez
Facebook http://www.facebook.com/jorgemirezperu
Linkedin https://www.linkedin.com/in/jorge-luis-mirez-tarrillo-94918423/
Scopus ID: https://www.scopus.com/authid/detail.uri?authorId=56488109800
Google Scholar: https://scholar.google.com/citations?user=_dSpp4YAAAAJ
MATLAB Group Admin in Facebook: https://www.facebook.com/groups/Matlab.Simulink.for.All
WhatsApp Channel/Canal: https://whatsapp.com/channel/0029VbCvpZsAYlUSz2esek2y
This post has to do with programming and simulating the power curve of a wind turbine and for example I have considered a capacity of 10 MW, with a starting speed of 3 m/s, a nominal speed of 10 m/s and a cutting speed of 25 m/s approx. The output power of wind turbine is described in terms of wind speed from the typical power curve characteristics of the windturbine as it is show in figure of the present post, where, Pw is the wind turbine output power, Pr is the rated output power of WT, u_c is the cut-in wind speed, u_r is the rated wind speed, and u_f is the cut-off wind speed.

Dr. Jorge Luis Mírez Tarrillo
Group of Mathematical Modeling and Numerical Simulation (GMMNS).
Universidad Nacional de Ingeniería. Lima, Perú.
E-mail: jmirez@uni.edu.pe
Website Personal: https://jorgemirez2002.wixsite.com/jorgemirez
Facebook http://www.facebook.com/jorgemirezperu
Linkedin https://www.linkedin.com/in/jorge-luis-mirez-tarrillo-94918423/
Scopus ID: https://www.scopus.com/authid/detail.uri?authorId=56488109800
Google Scholar: https://scholar.google.com/citations?user=_dSpp4YAAAAJ
MATLAB Group Admin in Facebook: https://www.facebook.com/groups/Matlab.Simulink.for.All
WhatsApp Channel/Canal: https://whatsapp.com/channel/0029VbCvpZsAYlUSz2esek2y
Wind resources and the electric power output from wind turbine at a particular location depend on wind speed at the hub height, the wind turbine speed characteristics. Wind speed at the hub height of wind turbine is calculated by the power law equation using the wind speed data collected at the anemometer height as the equation in figure where, u(h) and u(hg) are wind speeds at hub height (h ) and anemometer height (hg), respectively, and Greek letter alpha is the roughness factor considered as 1.0 and 1.4 for this post. In this simulation hg = 10 meters and u(hg) = 10 m/s. This simulation is the result of the implementation of the mathematical model in Matlab.


Dr. Jorge Luis Mírez Tarrillo
Group of Mathematical Modeling and Numerical Simulation (GMMNS).
Universidad Nacional de Ingeniería. Lima, Perú.
E-mail: jmirez@uni.edu.pe
Website Personal: https://jorgemirez2002.wixsite.com/jorgemirez
Facebook http://www.facebook.com/jorgemirezperu
Linkedin https://www.linkedin.com/in/jorge-luis-mirez-tarrillo-94918423/
Scopus ID: https://www.scopus.com/authid/detail.uri?authorId=56488109800
Google Scholar: https://scholar.google.com/citations?user=_dSpp4YAAAAJ
MATLAB Group Admin in Facebook: https://www.facebook.com/groups/Matlab.Simulink.for.All
WhatsApp Channel/Canal: https://whatsapp.com/channel/0029VbCvpZsAYlUSz2esek2y
En el presente video modelamos la potencia de la turbina eólica considerando la variación del área de barrido y la velocidad del viento, además, densidad y coeficiente de potencia se toman como constantes. Hecho en Matlab y 100 % práctico. Invitados a inscribirse en mi canal y seguirme en mis redes sociales.
Dr. Jorge Luis Mírez Tarrillo
Group of Mathematical Modeling and Numerical Simulation (GMMNS).
Universidad Nacional de Ingeniería. Lima, Perú.
E-mail: jmirez@uni.edu.pe
Website Personal: https://jorgemirez2002.wixsite.com/jorgemirez
Facebook http://www.facebook.com/jorgemirezperu
Linkedin https://www.linkedin.com/in/jorge-luis-mirez-tarrillo-94918423/
Scopus ID: https://www.scopus.com/authid/detail.uri?authorId=56488109800
Google Scholar: https://scholar.google.com/citations?user=_dSpp4YAAAAJ
MATLAB Group Admin in Facebook: https://www.facebook.com/groups/Matlab.Simulink.for.All
WhatsApp Channel/Canal: https://whatsapp.com/channel/0029VbCvpZsAYlUSz2esek2y
Estimados lectores, en las grandes ciudades y espacios interurbanos cada vez más poblados por el incremento en la población mundial, se va a tener en el futuro próximo – si es que no se tiene – el poder configurar las cargas eléctricas en conjuntos de multi-nanogrids y/o multi-microgrids. Todas ellas pueden tener su propio almacenamiento o tener un almacenamiento para todas ellas. La figura muestra que he podido modelar y simular el comportamiento de la energía guardada en una fuente de almacenamiento que recoge o suple de energía a todas las nanogrids y/o microgrids. Su importancia radica en el compartir los sobrantes para abastecer a las que les falta energía. Si existe sobrante pues saber hasta que valor pueden llegar. Si hay déficit entre todas as ellas, se realizar la compra de energía. Acá entran a tallar diferentes tipos de tecnologías entre electrónica de potencia, sistemas de control y protección. El comportamiento aleatorio ha sido considerado de todas maneras, pues es lo que sucede en la vida real. Si bien todo esto es modelamiento matemático y simulación numérica, se puede agregar datos reales si los hubiera. Espero sea de su interés y dejo mis datos de contacto en la firma del presente post. Gracias.

Dr. Jorge Luis Mírez Tarrillo
Group of Mathematical Modeling and Numerical Simulation (GMMNS).
Universidad Nacional de Ingeniería. Lima, Perú.
E-mail: jmirez@uni.edu.pe
Website Personal: https://jorgemirez2002.wixsite.com/jorgemirez
Facebook http://www.facebook.com/jorgemirezperu
Linkedin https://www.linkedin.com/in/jorge-luis-mirez-tarrillo-94918423/
Scopus ID: https://www.scopus.com/authid/detail.uri?authorId=56488109800
Google Scholar: https://scholar.google.com/citations?user=_dSpp4YAAAAJ
MATLAB Group Admin in Facebook: https://www.facebook.com/groups/Matlab.Simulink.for.All
WhatsApp Channel/Canal: https://whatsapp.com/channel/0029VbCvpZsAYlUSz2esek2y
Offshore wind has emerged as one of the most dynamic technologies in the energy system. For the first time in 2010 global capacity additions of offshore wind surpassed 1 gigawatt (GW). In 2018, a total of 4.3 GW of new offshore wind capacity was completed (see Figure). From 3 GW of offshore wind in operation in 2010, installed capacity expanded to
23 GW in 2018. Annual deployment has increased by nearly 30 % per year, higher than any other source of electricity except solar photovoltaics (PV). By mid-2019, there were over 5,500 offshore turbines connected to a grid in 17 countries. Policy support has been fundamental to this expansion, including through technology-specific capacity tenders, progress on including offshore wind in marine planning, financial support and regulatory efforts to support grid development.
The growth of the offshore wind industry has been fostered in European countries bordering the North Seas, where high quality wind resources and relatively shallow water have provided exceptionally good conditions in which to develop offshore wind technologies and bring them to market. Stable policies supported nearly 17 GW of offshore
wind capacity additions in Europe between 2010 and 2018. The United Kingdom, Germany, Belgium, Netherlands and Denmark together added 2.7 GW of capacity in 2018 alone. China has recently taken strides forward on offshore wind and now stands among the market leaders. In 2018, China added 1.6 GW of offshore wind capacity, the most of any
country. This rapid growth has been driven by the government’s 13th Five-Year Plan, which called for 5 GW of offshore wind capacity to be completed by 2020, and for the establishment of supply chains to support further expansion thereafter.

Source: IEA Offshore Wind Outlook 2019 https://www.iea.org/
Regards:
Dr. Jorge Luis Mírez Tarrillo
Group of Mathematical Modeling and Numerical Simulation (GMMNS).
Universidad Nacional de Ingeniería. Lima, Perú.
E-mail: jmirez@uni.edu.pe
Website Personal: https://jorgemirez2002.wixsite.com/jorgemirez
Facebook http://www.facebook.com/jorgemirezperu
Linkedin https://www.linkedin.com/in/jorge-luis-mirez-tarrillo-94918423/
Scopus ID: https://www.scopus.com/authid/detail.uri?authorId=56488109800
Google Scholar: https://scholar.google.com/citations?user=_dSpp4YAAAAJ
MATLAB Group Admin in Facebook: https://www.facebook.com/groups/Matlab.Simulink.for.All
WhatsApp Channel/Canal: https://whatsapp.com/channel/0029VbCvpZsAYlUSz2esek2y

Como generador de turbina de viento, un generador sincrónico de imanes permanentes (PMSG) es usado en el presente post. La energía mecánica es adquirida de la energía cinética del viento a través de una turbina de viento, y el PMSG convierte ésta energía a energía eléctrica. La salida de PMSG es convertida a potencia DC a través de un rectificador de tiristores. La potencia de salida de la turbina de viento es igual a la potencia convertida DC si las pérdidas en el generador y rectificador son despreciables.
Referencia: S. M. Muyeen «Wind Energy Conversion Systems – Technology and Trends» Springer. New York. DOI 10.1007/978-1-4471-2201-2
Regards:
Dr. Jorge Luis Mírez Tarrillo
Group of Mathematical Modeling and Numerical Simulation (GMMNS).
Universidad Nacional de Ingeniería. Lima, Perú.
E-mail: jmirez@uni.edu.pe
Website Personal: https://jorgemirez2002.wixsite.com/jorgemirez
Facebook http://www.facebook.com/jorgemirezperu
Linkedin https://www.linkedin.com/in/jorge-luis-mirez-tarrillo-94918423/
Scopus ID: https://www.scopus.com/authid/detail.uri?authorId=56488109800
Google Scholar: https://scholar.google.com/citations?user=_dSpp4YAAAAJ
MATLAB Group Admin in Facebook: https://www.facebook.com/groups/Matlab.Simulink.for.All
WhatsApp Channel/Canal: https://whatsapp.com/channel/0029VbCvpZsAYlUSz2esek2y
J1115: Entrevista hecha por la Revista Energía de Chile en el marco del Congreso BioBio Energía 2018
Durante el Congreso BioBio Energía 2018 que se realizó en la Ciudad de Concepción, la Revista Energía me hizo una entrevista cuyas preguntas y respuestas se plasman en el link líneas abajo. Dicha entrevista fue del todo cordial, amena, técnica y entretenida; pues la temática y el entorno del evento permitían un clima adecuado de fluencia de opiniones e ideas. Les dejo con ésta lectura que espero sea de su interés.

Link de la entrevista: https://www.revistaenergia.com/19388/
Dr. Jorge Luis Mírez Tarrillo
Group of Mathematical Modeling and Numerical Simulation (GMMNS).
Universidad Nacional de Ingeniería. Lima, Perú.
E-mail: jmirez@uni.edu.pe
Website Personal: https://jorgemirez2002.wixsite.com/jorgemirez
Facebook http://www.facebook.com/jorgemirezperu
Linkedin https://www.linkedin.com/in/jorge-luis-mirez-tarrillo-94918423/
Scopus ID: https://www.scopus.com/authid/detail.uri?authorId=56488109800
Google Scholar: https://scholar.google.com/citations?user=_dSpp4YAAAAJ
MATLAB Group Admin in Facebook: https://www.facebook.com/groups/Matlab.Simulink.for.All
WhatsApp Channel/Canal: https://whatsapp.com/channel/0029VbCvpZsAYlUSz2esek2y
 Source: Antonio Moreno-Munoz. “Large Scale Grid Integration of Renewable Energy Sources”. The Institution of Engineering and Technology. 2017.
Dr. Jorge Luis Mírez Tarrillo
Group of Mathematical Modeling and Numerical Simulation (GMMNS).
Universidad Nacional de Ingeniería. Lima, Perú.
E-mail: jmirez@uni.edu.pe
Website Personal: https://jorgemirez2002.wixsite.com/jorgemirez
Facebook http://www.facebook.com/jorgemirezperu
Linkedin https://www.linkedin.com/in/jorge-luis-mirez-tarrillo-94918423/
Scopus ID: https://www.scopus.com/authid/detail.uri?authorId=56488109800
Google Scholar: https://scholar.google.com/citations?user=_dSpp4YAAAAJ
MATLAB Group Admin in Facebook: https://www.facebook.com/groups/Matlab.Simulink.for.All
WhatsApp Channel/Canal: https://whatsapp.com/channel/0029VbCvpZsAYlUSz2esek2y
Fuente: Antonio Moreno-Munoz. «Large Scale Grid Integration of Renewable Energy Sources». The Institution of Engineering and Technology. 2017.
Dr. Jorge Luis Mírez Tarrillo
Group of Mathematical Modeling and Numerical Simulation (GMMNS).
Universidad Nacional de Ingeniería. Lima, Perú.
E-mail: jmirez@uni.edu.pe
Website Personal: https://jorgemirez2002.wixsite.com/jorgemirez
Facebook http://www.facebook.com/jorgemirezperu
Linkedin https://www.linkedin.com/in/jorge-luis-mirez-tarrillo-94918423/
Scopus ID: https://www.scopus.com/authid/detail.uri?authorId=56488109800
Google Scholar: https://scholar.google.com/citations?user=_dSpp4YAAAAJ
MATLAB Group Admin in Facebook: https://www.facebook.com/groups/Matlab.Simulink.for.All
WhatsApp Channel/Canal: https://whatsapp.com/channel/0029VbCvpZsAYlUSz2esek2y
Source: Antonio Moreno-Munoz. “Large Scale Grid Integration of Renewable Energy Sources”. The Institution of Engineering and Technology. 2017.
Dr. Jorge Luis Mírez Tarrillo
Group of Mathematical Modeling and Numerical Simulation (GMMNS).
Universidad Nacional de Ingeniería. Lima, Perú.
E-mail: jmirez@uni.edu.pe
Website Personal: https://jorgemirez2002.wixsite.com/jorgemirez
Facebook http://www.facebook.com/jorgemirezperu
Linkedin https://www.linkedin.com/in/jorge-luis-mirez-tarrillo-94918423/
Scopus ID: https://www.scopus.com/authid/detail.uri?authorId=56488109800
Google Scholar: https://scholar.google.com/citations?user=_dSpp4YAAAAJ
MATLAB Group Admin in Facebook: https://www.facebook.com/groups/Matlab.Simulink.for.All
WhatsApp Channel/Canal: https://whatsapp.com/channel/0029VbCvpZsAYlUSz2esek2y
Fuente: Antonio Moreno-Munoz. «Large Scale Grid Integration of Renewable Energy Sources». The Institution of Engineering and Technology. 2017.
Dr. Jorge Luis Mírez Tarrillo
Group of Mathematical Modeling and Numerical Simulation (GMMNS).
Universidad Nacional de Ingeniería. Lima, Perú.
E-mail: jmirez@uni.edu.pe
Website Personal: https://jorgemirez2002.wixsite.com/jorgemirez
Facebook http://www.facebook.com/jorgemirezperu
Linkedin https://www.linkedin.com/in/jorge-luis-mirez-tarrillo-94918423/
Scopus ID: https://www.scopus.com/authid/detail.uri?authorId=56488109800
Google Scholar: https://scholar.google.com/citations?user=_dSpp4YAAAAJ
MATLAB Group Admin in Facebook: https://www.facebook.com/groups/Matlab.Simulink.for.All
WhatsApp Channel/Canal: https://whatsapp.com/channel/0029VbCvpZsAYlUSz2esek2y
Blog in ENGLISH

Compra/Buy – Haz una donación/Make a donation

Dear reader, if you wish to make a donation or are interested in any information or code, please contact me (e-mail: jmirez@uni.edu.pe). Donations will allow you to continue studying and researching, and also to provide more information on this blog. My PayPal account is jorgemirez2002@gmail.com or if it is by bank transfer write to my email jmirez@uni.edu.pe. Any amount of money is welcome. Thank you.
Estimado lector, si desean hacer una donación o le interesa alguna información o código, favor ponerse en contacto con mi persona (e-mail: jmirez@uni.edu.pe). Las donaciones va a permitir seguir estudiando e investigando, y además, el poder brindar más información en este blog. Mi cuenta en PayPal es jorgemirez2002@gmail.com o si es por transferencia bancaria escribirme a mi correo jmirez@uni.edu.pe. Cualquier cantidad de dinero es bienvenido. Gracias.
Datos Generales
Good day. My full name is Jorge Luis MIREZ TARRILLO.
I am Peruvian and live in Lima, capital of Perú in South America.I am Mechanical Electrical Engineering, MSc Physics and Dr. Physics (title doctoral thesis: Control, Optimization, and Management of Microgrid Current Direct)
Too, actually job as Principal Professor in Faculty of Oil, Gas and Petrochemical Engineering of Universidad Nacional de Ingeniería (National University of Engineering) in Lima – PERU (Courses: Modern Physics, Differential Equations and Research's Methodology)
My subjects of my interest are control, signal processing, optimization, simulation, biomedical research, smart grid, microgrid, water.
I have experience in Matlab/Simulink programming, biomedical equipment, electrical systems, renewable energies, microgrids, saturated steam systems 100 psi and organizing academic events.
Comentarios Recientes
Elementos que compon… en J506: Los elementos de un paqu… Dr. Jorge Mírez en Message by IEEE Community Dr. Jorge Mírez en J546: Simulación de campos mag… jose luis huayanay v… en Message by IEEE Community Cesar Aviles en J546: Simulación de campos mag… Dr. Jorge Mírez en J518: La herramienta pdetool d… Dr. Jorge Mírez en J496: Simulación en Matlab/Sim… Raúl Barrios Elizarr… en J496: Simulación en Matlab/Sim… jose luis huayanay v… en J518: La herramienta pdetool d… MSc. Jorge Mírez en J281: La Rosa de Vientos: Frec…
Debe estar conectado para enviar un comentario.