Archive for the ‘Sistema Eléctrico System Electric’ Category

This is my simulation made on Matlab/Simulink about difference time of conextion in bank condensers. The reactive power change in the time and it is aleatory. In this context, the mathematical models have that made the emulation of this performance.
Dr. Jorge Luis Mírez Tarrillo
Group of Mathematical Modeling and Numerical Simulation (GMMNS).
Universidad Nacional de Ingeniería. Lima, Perú.
E-mail: jmirez@uni.edu.pe
Website Personal: https://jorgemirez2002.wixsite.com/jorgemirez
Facebook http://www.facebook.com/jorgemirezperu
Linkedin https://www.linkedin.com/in/jorge-luis-mirez-tarrillo-94918423/
Scopus ID: https://www.scopus.com/authid/detail.uri?authorId=56488109800
Google Scholar: https://scholar.google.com/citations?user=_dSpp4YAAAAJ
MATLAB Group Admin in Facebook: https://www.facebook.com/groups/Matlab.Simulink.for.All
WhatsApp Channel/Canal: https://whatsapp.com/channel/0029VbCvpZsAYlUSz2esek2y
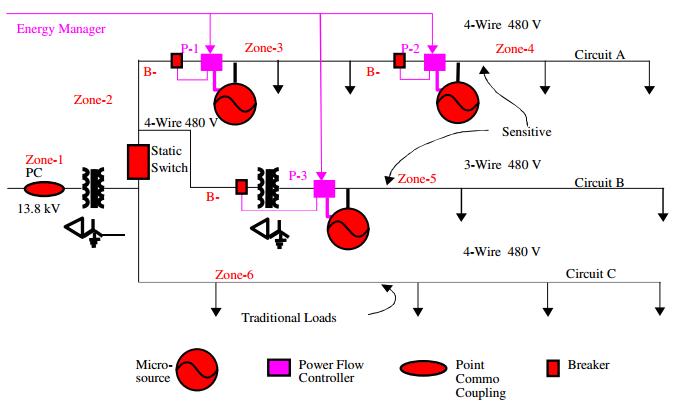
The CERTS Microgrid program has developed control methods to allow the installation of distributed generators (DGs) in commercial and industrial electric power systems in a “plug and play” manner. These control methods allow the generators to be electrically distributed, rather than be installed on the same electrical bus, and do not require intergenerator communications in order to maintain appropriate voltage and frequency at each generator. Note in figure that there is a communication link with the DGs that is labeled “Energy Manager”. This is a conventional energy manager that is used for power dispatch purposes, not for frequency or voltage control. This energy manager can use relatively slow communications links, such as telephone or internet, since it has no bearing on system stability.
Source:
John Stevens «CERTS Microgrid System Test». IEEExplore
Dr. Jorge Luis Mírez Tarrillo
Group of Mathematical Modeling and Numerical Simulation (GMMNS).
Universidad Nacional de Ingeniería. Lima, Perú.
E-mail: jmirez@uni.edu.pe
Website Personal: https://jorgemirez2002.wixsite.com/jorgemirez
Facebook http://www.facebook.com/jorgemirezperu
Linkedin https://www.linkedin.com/in/jorge-luis-mirez-tarrillo-94918423/
Scopus ID: https://www.scopus.com/authid/detail.uri?authorId=56488109800
Google Scholar: https://scholar.google.com/citations?user=_dSpp4YAAAAJ
MATLAB Group Admin in Facebook: https://www.facebook.com/groups/Matlab.Simulink.for.All
WhatsApp Channel/Canal: https://whatsapp.com/channel/0029VbCvpZsAYlUSz2esek2y

The basic philosophy in developing the perfect power system is first to increase the independence, flexibility, and intelligence for optimization of energy use and energy management at the local level; and then to integrate local systems as necessary or justified for deliveringperfect power supply and services.
This path started with the notion that increasingly consumers expect perfection in the end-use devices and appliances they have. Not only does portability enable a highly mobile digital society; but also once perfection in portability is defined, it provides elements of perfection that enable, in turn, a localize perfect system. Localized perfect systems can also accommodate increasing consumer demands for independence, convenience, appearance, environmentally friendly service and cost control.
Local systems can in turn be integrated into distributed perfect systems. Distributed perfect systems can, in turn be interconnected and integrated with technologies that ultimately enable a fully integrated perfect power system. The figure summarizes each of these system configuration stages.
Each of these configurations can essentially be considered a possible structure for the perfect power system in its own right, but each stage logically evolves to the next stage based on the efficiencies, and quality or service value improvements to be attained. In effect, these potential system configuration stages build on each other starting from a portable power system connected to other portable power systems which then can evolve into a building integrated power system, a distributed power system and eventually to a fully integrated power system.
Source:
Clark W. Gellings.The Smart Grid. CRC Press. 2009. ISBN-10 0-88173-623-6
Dr. Jorge Luis Mírez Tarrillo
Group of Mathematical Modeling and Numerical Simulation (GMMNS).
Universidad Nacional de Ingeniería. Lima, Perú.
E-mail: jmirez@uni.edu.pe
Website Personal: https://jorgemirez2002.wixsite.com/jorgemirez
Facebook http://www.facebook.com/jorgemirezperu
Linkedin https://www.linkedin.com/in/jorge-luis-mirez-tarrillo-94918423/
Scopus ID: https://www.scopus.com/authid/detail.uri?authorId=56488109800
Google Scholar: https://scholar.google.com/citations?user=_dSpp4YAAAAJ
MATLAB Group Admin in Facebook: https://www.facebook.com/groups/Matlab.Simulink.for.All
WhatsApp Channel/Canal: https://whatsapp.com/channel/0029VbCvpZsAYlUSz2esek2y

This is a part of my results about interconnected of two microgrids. It have flow power in function a its capacities, but probably a deficit and/or surplus in supply or demand in both microgrids is present. Negative is deficit in microgrid to import from other source different to other microgrid. Positivo is surplus in microgrid by export to other demand different at other microgrid. The figure is a simple example for to show that it is possible using mathematical modelling and simulations on Matlab of MathWork Inc.
Dr. Jorge Luis Mírez Tarrillo
Group of Mathematical Modeling and Numerical Simulation (GMMNS).
Universidad Nacional de Ingeniería. Lima, Perú.
E-mail: jmirez@uni.edu.pe
Website Personal: https://jorgemirez2002.wixsite.com/jorgemirez
Facebook http://www.facebook.com/jorgemirezperu
Linkedin https://www.linkedin.com/in/jorge-luis-mirez-tarrillo-94918423/
Scopus ID: https://www.scopus.com/authid/detail.uri?authorId=56488109800
Google Scholar: https://scholar.google.com/citations?user=_dSpp4YAAAAJ
MATLAB Group Admin in Facebook: https://www.facebook.com/groups/Matlab.Simulink.for.All
WhatsApp Channel/Canal: https://whatsapp.com/channel/0029VbCvpZsAYlUSz2esek2y

This is part of my results in Matlab about power flow between two microgrids interconected. In different color shown the direction of power flow (from Microgrid 1 to Microgrid 2, and from Microgrid 2 to Microgrid 1). The figure is a simple example for to show that it is possible using mathematical modelling and simulations on Matlab of MathWork Inc.
Dr. Jorge Luis Mírez Tarrillo
Group of Mathematical Modeling and Numerical Simulation (GMMNS).
Universidad Nacional de Ingeniería. Lima, Perú.
E-mail: jmirez@uni.edu.pe
Website Personal: https://jorgemirez2002.wixsite.com/jorgemirez
Facebook http://www.facebook.com/jorgemirezperu
Linkedin https://www.linkedin.com/in/jorge-luis-mirez-tarrillo-94918423/
Scopus ID: https://www.scopus.com/authid/detail.uri?authorId=56488109800
Google Scholar: https://scholar.google.com/citations?user=_dSpp4YAAAAJ
MATLAB Group Admin in Facebook: https://www.facebook.com/groups/Matlab.Simulink.for.All
WhatsApp Channel/Canal: https://whatsapp.com/channel/0029VbCvpZsAYlUSz2esek2y

This figure represents the electrical demand in Ecuador. It is noted that during the study period, nearly doubled the demand for electricity. Currently Ecuador already has a transmission line at 500 kV. With technology centers as Yachay, I recommend that Ecuador must bet for the development of technologies such as solar photovoltaics, wind turbines and biomass. Other technologies are possible and with higher added value.
Dr. Jorge Luis Mírez Tarrillo
Group of Mathematical Modeling and Numerical Simulation (GMMNS).
Universidad Nacional de Ingeniería. Lima, Perú.
E-mail: jmirez@uni.edu.pe
Website Personal: https://jorgemirez2002.wixsite.com/jorgemirez
Facebook http://www.facebook.com/jorgemirezperu
Linkedin https://www.linkedin.com/in/jorge-luis-mirez-tarrillo-94918423/
Scopus ID: https://www.scopus.com/authid/detail.uri?authorId=56488109800
Google Scholar: https://scholar.google.com/citations?user=_dSpp4YAAAAJ
MATLAB Group Admin in Facebook: https://www.facebook.com/groups/Matlab.Simulink.for.All
WhatsApp Channel/Canal: https://whatsapp.com/channel/0029VbCvpZsAYlUSz2esek2y

This is my simulation about the to work (on-off) of condenser bank. This bank is made by many condensers of different capacity. The model and simulation is implemented on Matlab of MathWork Inc. The little difference is result of maximun capacity and real reactive demand.
Dr. Jorge Luis Mírez Tarrillo
Group of Mathematical Modeling and Numerical Simulation (GMMNS).
Universidad Nacional de Ingeniería. Lima, Perú.
E-mail: jmirez@uni.edu.pe
Website Personal: https://jorgemirez2002.wixsite.com/jorgemirez
Facebook http://www.facebook.com/jorgemirezperu
Linkedin https://www.linkedin.com/in/jorge-luis-mirez-tarrillo-94918423/
Scopus ID: https://www.scopus.com/authid/detail.uri?authorId=56488109800
Google Scholar: https://scholar.google.com/citations?user=_dSpp4YAAAAJ
MATLAB Group Admin in Facebook: https://www.facebook.com/groups/Matlab.Simulink.for.All
WhatsApp Channel/Canal: https://whatsapp.com/channel/0029VbCvpZsAYlUSz2esek2y

This is a important data in my research and in any calculate by size conductors wire in distribution system and applicantions in house, industry and similars.
Source:
http://www.usawire-cable.com/pdfs/nec%20ampacities.pdf
Dr. Jorge Luis Mírez Tarrillo
Group of Mathematical Modeling and Numerical Simulation (GMMNS).
Universidad Nacional de Ingeniería. Lima, Perú.
E-mail: jmirez@uni.edu.pe
Website Personal: https://jorgemirez2002.wixsite.com/jorgemirez
Facebook http://www.facebook.com/jorgemirezperu
Linkedin https://www.linkedin.com/in/jorge-luis-mirez-tarrillo-94918423/
Scopus ID: https://www.scopus.com/authid/detail.uri?authorId=56488109800
Google Scholar: https://scholar.google.com/citations?user=_dSpp4YAAAAJ
MATLAB Group Admin in Facebook: https://www.facebook.com/groups/Matlab.Simulink.for.All
WhatsApp Channel/Canal: https://whatsapp.com/channel/0029VbCvpZsAYlUSz2esek2y

During operation a microgrid, sometimes; renewable energy sources and the external power grid, dispatched electric energy simultaneously. Sometimes, many sources is neccesary for supply to electric load. Also, all it, considering both economic and technical criteria. The figure represent la connection and disconnetion of sources for each state of performance of a microgrid. Too, it is applicable to other similar electric systems.
Dr. Jorge Luis Mírez Tarrillo
Group of Mathematical Modeling and Numerical Simulation (GMMNS).
Universidad Nacional de Ingeniería. Lima, Perú.
E-mail: jmirez@uni.edu.pe
Website Personal: https://jorgemirez2002.wixsite.com/jorgemirez
Facebook http://www.facebook.com/jorgemirezperu
Linkedin https://www.linkedin.com/in/jorge-luis-mirez-tarrillo-94918423/
Scopus ID: https://www.scopus.com/authid/detail.uri?authorId=56488109800
Google Scholar: https://scholar.google.com/citations?user=_dSpp4YAAAAJ
MATLAB Group Admin in Facebook: https://www.facebook.com/groups/Matlab.Simulink.for.All
WhatsApp Channel/Canal: https://whatsapp.com/channel/0029VbCvpZsAYlUSz2esek2y

The figure shows the minimum requirements for a VPP: a number of small participants (consumers or DERs); a communications network (the internet or dedicated lines); a communication platform with a common information model and a consensus on the communication architecture; a primary energy supply network; and a link to the energy market. The primary energy supply is the foundation of the VPP, the communication system forms the glue holding the VPP together, and the market link is the incentive which drives the system to service the needs of its owners and customers.A VPP may be dispersed over a large area, though in the case of islands and other microgrids it may equally well have tight geographical limits.
Source:
Riso Energy Report 8. “The intelligent energy system infraestructure for the future”. Riso National Laboratory. Technical University of Denmark. September 2009. ISBN 978-87-550-3754-0
Dr. Jorge Luis Mírez Tarrillo
Group of Mathematical Modeling and Numerical Simulation (GMMNS).
Universidad Nacional de Ingeniería. Lima, Perú.
E-mail: jmirez@uni.edu.pe
Website Personal: https://jorgemirez2002.wixsite.com/jorgemirez
Facebook http://www.facebook.com/jorgemirezperu
Linkedin https://www.linkedin.com/in/jorge-luis-mirez-tarrillo-94918423/
Scopus ID: https://www.scopus.com/authid/detail.uri?authorId=56488109800
Google Scholar: https://scholar.google.com/citations?user=_dSpp4YAAAAJ
MATLAB Group Admin in Facebook: https://www.facebook.com/groups/Matlab.Simulink.for.All
WhatsApp Channel/Canal: https://whatsapp.com/channel/0029VbCvpZsAYlUSz2esek2y

Transient changes in load power demand may result from faults in transmission line or load switching. For instance, a 75-kW Honeywell micro-turbine took about 35 s to respond for a 50%change in power demand under the grid-connected mode of operation.On the other hand, some fuel cells require about 10 s for a 15% change in power output.Furthermore, a fuel cell also has a recovery period of a few minutes to establish equilibrium before it can meet another step change in power output. The typical response that can be expected of a micro-turbine for a step change in load demand is illustrated in Figure. In the figure, PL denotes the load power demand, PS is the response of the micro-turbine, and (PL-PS) is the short age in power that needs to be supplied through some means. Inthe grid-connected mode of operation, the grid supplies the shortage in power until the micro-source responds to a step changein power demand. However, in the island mode of operation, this sudden demand can be met only if
additional storage is included in the MSDG system.
Source:
G. Venkataramanan, M.S. Illindala, C. Houle, and R.H. Lasseter. «Hardware Development of a Laboratory-Scale Microgrid Phase 1—Single Inverter in Island Mode Operation». NREL. November 2002 • NREL/SR-560-32527
Dr. Jorge Luis Mírez Tarrillo
Group of Mathematical Modeling and Numerical Simulation (GMMNS).
Universidad Nacional de Ingeniería. Lima, Perú.
E-mail: jmirez@uni.edu.pe
Website Personal: https://jorgemirez2002.wixsite.com/jorgemirez
Facebook http://www.facebook.com/jorgemirezperu
Linkedin https://www.linkedin.com/in/jorge-luis-mirez-tarrillo-94918423/
Scopus ID: https://www.scopus.com/authid/detail.uri?authorId=56488109800
Google Scholar: https://scholar.google.com/citations?user=_dSpp4YAAAAJ
MATLAB Group Admin in Facebook: https://www.facebook.com/groups/Matlab.Simulink.for.All
WhatsApp Channel/Canal: https://whatsapp.com/channel/0029VbCvpZsAYlUSz2esek2y

Electricity meters are used to measure the quantity of electricity supplied to customers as well as to calculate energy and transportation charges for electricity retailers and network operators. The most common type of meter is an accumulation meter, which records energy consumption over time. Accumulation meters in consumer premises are read manually to assess how much energy has been used within a billing period. In recent years, industrial and commercial consumers with large loads have increasingly been using more advanced meters, for example, interval meters which record energy use over short intervals, typically every half hour. This allows the energy suppliers to design tariffs and charging structures that reflect wholesale prices and helps the customers understand and manage their pattern of electricity demand. Smart meters are even more sophisticated as they have two-way communications and provide a real-time display of energy use and pricing information, dynamic tariffs and facilitate the automatic control of electrical appliances
Source:
SMART GRID
TECHNOLOGY AND APPLICATIONS
Janaka Ekanayake
Cardiff University, UK
Kithsiri Liyanage
University of Peradeniya, Sri Lanka
Jianzhong Wu
Cardiff University, UK
Akihiko Yokoyama
University of Tokyo, Japan
Nick Jenkins
Cardiff University, UK
A John Wiley & Sons, Ltd., Publication
Dr. Jorge Luis Mírez Tarrillo
Group of Mathematical Modeling and Numerical Simulation (GMMNS).
Universidad Nacional de Ingeniería. Lima, Perú.
E-mail: jmirez@uni.edu.pe
Website Personal: https://jorgemirez2002.wixsite.com/jorgemirez
Facebook http://www.facebook.com/jorgemirezperu
Linkedin https://www.linkedin.com/in/jorge-luis-mirez-tarrillo-94918423/
Scopus ID: https://www.scopus.com/authid/detail.uri?authorId=56488109800
Google Scholar: https://scholar.google.com/citations?user=_dSpp4YAAAAJ
MATLAB Group Admin in Facebook: https://www.facebook.com/groups/Matlab.Simulink.for.All
WhatsApp Channel/Canal: https://whatsapp.com/channel/0029VbCvpZsAYlUSz2esek2y

The communication infrastructure of a power system typically consists of SCADA systems with dedicated communication channels to and from the System Control Centre and a Wide Area Network (WAN). Some long-established power utilities may have private telephone networks and other legacy communication systems. The SCADA systems connect all the major power system operational facilities, that is, the central generating stations, the transmission grid substations and the primary distribution substations to the System Control Centre. The WAN is used for corporate business and market operations. These form the core communication networks of the traditional power system. However, in the Smart Grid,it is expected that these two elements of communication infrastructure will merge into a Utility WAN.
An essential development of the Smart Grid (see figure ) is to extend communication throughout the distribution system and to establish two-way communications with customers through Neighbourhood Area Networks (NANs) covering the areas served by distribution substations. Customers’ premises will have Home Area Networks (HANs). The interface of the Home and Neighbourhood Area Networks will be through a smart meter or smart interfacing device.
Source:
SMART GRID
TECHNOLOGY AND APPLICATIONS
Janaka Ekanayake
Cardiff University, UK
Kithsiri Liyanage
University of Peradeniya, Sri Lanka
Jianzhong Wu
Cardiff University, UK
Akihiko Yokoyama
University of Tokyo, Japan
Nick Jenkins
Cardiff University, UK
A John Wiley & Sons, Ltd., Publication
Dr. Jorge Luis Mírez Tarrillo
Group of Mathematical Modeling and Numerical Simulation (GMMNS).
Universidad Nacional de Ingeniería. Lima, Perú.
E-mail: jmirez@uni.edu.pe
Website Personal: https://jorgemirez2002.wixsite.com/jorgemirez
Facebook http://www.facebook.com/jorgemirezperu
Linkedin https://www.linkedin.com/in/jorge-luis-mirez-tarrillo-94918423/
Scopus ID: https://www.scopus.com/authid/detail.uri?authorId=56488109800
Google Scholar: https://scholar.google.com/citations?user=_dSpp4YAAAAJ
MATLAB Group Admin in Facebook: https://www.facebook.com/groups/Matlab.Simulink.for.All
WhatsApp Channel/Canal: https://whatsapp.com/channel/0029VbCvpZsAYlUSz2esek2y

The figure shows the DMSC controller building blocks that assess operating conditions and find the control settings for devices connected to the network. The key functions of the DMSC are state estimation, bad data detection and the calculation of optimal control settings. The DMSC receives a limited number of real-time measurements at set intervals from the network nodes. The measurements are normally voltage, load injections and power flow measurements from the primary substation and other secondary substations. These measurements are used to calculate the network operating conditions. In addition to these real-time measurements, the DMSC uses load models to forecast load injections at each node on the network for a given period that coincides with the real-time measurements. The network topology and impedances are also supplied to the DMSC.
The state estimator uses this data to assess the network conditions in terms of node voltage magnitudes, line power flows and network injections. Bad measurements coming to the system will be filtered using bad data detection and identification methods.
Source:
SMART GRID
TECHNOLOGY AND APPLICATIONS
Janaka Ekanayake
Cardiff University, UK
Kithsiri Liyanage
University of Peradeniya, Sri Lanka
Jianzhong Wu
Cardiff University, UK
Akihiko Yokoyama
University of Tokyo, Japan
Nick Jenkins
Cardiff University, UK
A John Wiley & Sons, Ltd., Publication
Dr. Jorge Luis Mírez Tarrillo
Group of Mathematical Modeling and Numerical Simulation (GMMNS).
Universidad Nacional de Ingeniería. Lima, Perú.
E-mail: jmirez@uni.edu.pe
Website Personal: https://jorgemirez2002.wixsite.com/jorgemirez
Facebook http://www.facebook.com/jorgemirezperu
Linkedin https://www.linkedin.com/in/jorge-luis-mirez-tarrillo-94918423/
Scopus ID: https://www.scopus.com/authid/detail.uri?authorId=56488109800
Google Scholar: https://scholar.google.com/citations?user=_dSpp4YAAAAJ
MATLAB Group Admin in Facebook: https://www.facebook.com/groups/Matlab.Simulink.for.All
WhatsApp Channel/Canal: https://whatsapp.com/channel/0029VbCvpZsAYlUSz2esek2y

The present post describe the charge and discharge process of a battery bank of a microgrid. This microgrid have a aleatory voltage with inferior and superior limit. The current and electric power of charge and discharge is in picture. This simulation has writing and processing on Matlab/Simulink of MathaWorth Inc. Actually my interest is the control, optimization and management of microgrid DC. Greetings from Perú.
The information related to this post for sale for US $ 1000.00. You can make payments through PayPal account: jorgemirez2002@gmail.com or send an e-mail to receive PayPal invoice and make your payment quickly and easily. Tell us (through e-mail) the name of the input or inputs that interests you. // La información relacionada con este post en venta por US $ 1000.00. Usted puede hacer pagos a través de cuenta PayPal: jorgemirez2002@gmail.com o enviar un e-mail para recibir la factura de PayPal y hacer su pago de forma rápida y sencilla. Díganos (por medio de email) el nombre de la entrada o entradas que le interese.
Dr. Jorge Luis Mírez Tarrillo
Group of Mathematical Modeling and Numerical Simulation (GMMNS).
Universidad Nacional de Ingeniería. Lima, Perú.
E-mail: jmirez@uni.edu.pe
Website Personal: https://jorgemirez2002.wixsite.com/jorgemirez
Facebook http://www.facebook.com/jorgemirezperu
Linkedin https://www.linkedin.com/in/jorge-luis-mirez-tarrillo-94918423/
Scopus ID: https://www.scopus.com/authid/detail.uri?authorId=56488109800
Google Scholar: https://scholar.google.com/citations?user=_dSpp4YAAAAJ
MATLAB Group Admin in Facebook: https://www.facebook.com/groups/Matlab.Simulink.for.All
WhatsApp Channel/Canal: https://whatsapp.com/channel/0029VbCvpZsAYlUSz2esek2y

La figura muestra el concepto de un sistema híbrido ac/dc donde varias fuentes y cargas ac y dc son conectadas a sus correspondientes redes ac y dc. Las redes ac y dc están conectadas a través de dos transformadores y conversores trifásicos ac/dc bidireccionales. Pueden observar la diversidad de micro fuentes que se está utilizando en la descripción de la microred, incluye los diferentes dispositivos de electrónica de potencia que sirven para adecuar la energía eléctrica desde fuentes y para cargas eléctricas. Hay vehículos eléctricos conectados a la microred. Los generadores eólicos tienen diferentes configuración de control (diferentes tipos de turbinas eólicas). Un grupo electrógeno diesel también se da, dado que estos grupos se consideran los que en último caso darán energía a la microred eléctrica en situaciones ya críticas pero a la vez rentables en lo posible en economía. Para todo esto se crea modelos matemáticos de cada elemento y luego se integran en un solo programa en que se puedan cambiar las condiciones de trabajo y analizar las variables de respuesta de lo que se desea estudiar. Yo lo hago en Matlab/Simulink para quienes deseen que les brinde el servicio de asesoramiento.
The information related to this post for sale for US $ 10.00. You can make payments through PayPal account: jorgemirez2002@gmail.com or send an e-mail to receive PayPal invoice and make your payment quickly and easily. Tell us (through e-mail) the name of the input or inputs that interests you. // La información relacionada con este post en venta por US $ 10.00. Usted puede hacer pagos a través de cuenta PayPal: jorgemirez2002@gmail.com o enviar un e-mail para recibir la factura de PayPal y hacer su pago de forma rápida y sencilla. Díganos (por medio de email) el nombre de la entrada o entradas que le interese.
Dr. Jorge Luis Mírez Tarrillo
Group of Mathematical Modeling and Numerical Simulation (GMMNS).
Universidad Nacional de Ingeniería. Lima, Perú.
E-mail: jmirez@uni.edu.pe
Website Personal: https://jorgemirez2002.wixsite.com/jorgemirez
Facebook http://www.facebook.com/jorgemirezperu
Linkedin https://www.linkedin.com/in/jorge-luis-mirez-tarrillo-94918423/
Scopus ID: https://www.scopus.com/authid/detail.uri?authorId=56488109800
Google Scholar: https://scholar.google.com/citations?user=_dSpp4YAAAAJ
MATLAB Group Admin in Facebook: https://www.facebook.com/groups/Matlab.Simulink.for.All
WhatsApp Channel/Canal: https://whatsapp.com/channel/0029VbCvpZsAYlUSz2esek2y

La distorción armónica total de la corriente de salida en el rango de operación de un generador debe ser menor que 5 % de la corriente fundamental. La tabla muestra el valor de los armónicos que no deben exceder esos límites, expresados en relación a la corriente fundamental. Se habla de armónicos pares e impares, interesan todos dado que dependiendo del armónicos los efectos son diferentes, algunos de ellos se les puede reconocer con los cinco sentidos, otros requieren equipos como Analizadores de Redes Eléctricas. Que hacer en lugares con alta distorción armónica?. Una de las formas más fáciles es colocar un transformador de impedancia y un transformador de aislamiento (corregirme si me equivoco). Sin embargo, estas cosas para instalaciones medianas y grandes resultan bastante caras y espaciosas, considerando también las pérdidas asociadas a su funcionamiento. Por lo tanto, como cliente es pararse bien frente a las empresas de electricidad y como autoproductor de electricidad es comprar un buen generador que cumpla las exigencias de calidad de energía eléctrica, de esta manera proteges tu inversión y obtienes una fiabilidad alta y rentabilidad bastante ya que el beneficio es para toda la instalación (máquinas y sistemas de iluminación que en condiciones adecuadas brinda clima laboral adecuado sin flickers y/o baja iluminación).
The information related to this post for sale for US $ 1000.00. You can make payments through PayPal account: jorgemirez2002@gmail.com or send an e-mail to receive PayPal invoice and make your payment quickly and easily. Tell us (through e-mail) the name of the input or inputs that interests you. // La información relacionada con este post en venta por US $ 1000.00. Usted puede hacer pagos a través de cuenta PayPal: jorgemirez2002@gmail.com o enviar un e-mail para recibir la factura de PayPal y hacer su pago de forma rápida y sencilla. Díganos (por medio de email) el nombre de la entrada o entradas que le interese.
Dr. Jorge Luis Mírez Tarrillo
Group of Mathematical Modeling and Numerical Simulation (GMMNS).
Universidad Nacional de Ingeniería. Lima, Perú.
E-mail: jmirez@uni.edu.pe
Website Personal: https://jorgemirez2002.wixsite.com/jorgemirez
Facebook http://www.facebook.com/jorgemirezperu
Linkedin https://www.linkedin.com/in/jorge-luis-mirez-tarrillo-94918423/
Scopus ID: https://www.scopus.com/authid/detail.uri?authorId=56488109800
Google Scholar: https://scholar.google.com/citations?user=_dSpp4YAAAAJ
MATLAB Group Admin in Facebook: https://www.facebook.com/groups/Matlab.Simulink.for.All
WhatsApp Channel/Canal: https://whatsapp.com/channel/0029VbCvpZsAYlUSz2esek2y

En este post muestro la portada de tesis «Implementación de un Sistema de Generación Distribuida con Energías Renovables ENDE Corporación» elaborado por Mario Torrico para la Universidad Privada del Valle en Cochabamba – Bolivia para optar el título de Ingeniero Electromecánico. Trabajo que compartimos durante unos tres meses de intercambio de información, modelos matemáticos y simulaciones numéricas, además de diálogo, envío de información, debate y varios borradores de tesis que iban y venían en el correo electrónico. Su defensa fue un éxito alcanzando la nota de 90/100 para alegría de Mario, de su familia, profesores, colegas y amigos. Éxitos Mario en tu vida profesional, tengo un colega amigo más :)D . En lo personal el tema fue muy interesante e implicó ingresar en una temática no desarrollada e innovadora… la portada de la tesis esta bonita también. Saludos a la plurinación boliviana… A quienes desean desarrollar conmigo sus tesis (Yo como Asesor Externo) a nivel de pregrado y postgrado, así como desarrollar sus proyectos de investigación tanto en universidades, institutos o empresas me escriben.
Dr. Jorge Luis Mírez Tarrillo
Group of Mathematical Modeling and Numerical Simulation (GMMNS).
Universidad Nacional de Ingeniería. Lima, Perú.
E-mail: jmirez@uni.edu.pe
Website Personal: https://jorgemirez2002.wixsite.com/jorgemirez
Facebook http://www.facebook.com/jorgemirezperu
Linkedin https://www.linkedin.com/in/jorge-luis-mirez-tarrillo-94918423/
Scopus ID: https://www.scopus.com/authid/detail.uri?authorId=56488109800
Google Scholar: https://scholar.google.com/citations?user=_dSpp4YAAAAJ
MATLAB Group Admin in Facebook: https://www.facebook.com/groups/Matlab.Simulink.for.All
WhatsApp Channel/Canal: https://whatsapp.com/channel/0029VbCvpZsAYlUSz2esek2y

Quienes hemos visto como funciona un banco de condensadores, podemos ver y escuchar el conectar y desconectar de los condensadores los cuales se van conectando dependiendo de la necesidad de potencia reactiva a inyectar y de las acciones del sistema de control. En la figura se muestra un ejemplo de funcionamiento de condensador para unos 100 estados o ciclos de trabajo, medida que he usado en esta figura, dado que la necesidad de potencia reactiva no depende de la escala de tiempo, es por lo general aleatoria, entonces lo que puedo ir determinando es si esta en conectado ON o desconectado OFF. Un sistema de ceros y unos sirven para identificar cada estado. La simulación está hecha en Matlab de MathWork Inc y complementa lo que post atrás es la ponencia que realice en Costa Rica durante el III Congreso Iberoamericano de Microredes con Generación Distribuida de Renovables. Favor difundir éste blog y si les interesa mis servicios, me escriben :)D
The information related to this post for sale for US $ 100.00. You can make payments through PayPal account: jorgemirez2002@gmail.com or send an e-mail to receive PayPal invoice and make your payment quickly and easily. Tell us (through e-mail) the name of the input or inputs that interests you. // La información relacionada con este post en venta por US $ 100.00. Usted puede hacer pagos a través de cuenta PayPal: jorgemirez2002@gmail.com o enviar un e-mail para recibir la factura de PayPal y hacer su pago de forma rápida y sencilla. Díganos (por medio de email) el nombre de la entrada o entradas que le interese.
Dr. Jorge Luis Mírez Tarrillo
Group of Mathematical Modeling and Numerical Simulation (GMMNS).
Universidad Nacional de Ingeniería. Lima, Perú.
E-mail: jmirez@uni.edu.pe
Website Personal: https://jorgemirez2002.wixsite.com/jorgemirez
Facebook http://www.facebook.com/jorgemirezperu
Linkedin https://www.linkedin.com/in/jorge-luis-mirez-tarrillo-94918423/
Scopus ID: https://www.scopus.com/authid/detail.uri?authorId=56488109800
Google Scholar: https://scholar.google.com/citations?user=_dSpp4YAAAAJ
MATLAB Group Admin in Facebook: https://www.facebook.com/groups/Matlab.Simulink.for.All
WhatsApp Channel/Canal: https://whatsapp.com/channel/0029VbCvpZsAYlUSz2esek2y

La energía reactiva solicitada por los diferentes dispositivos como motores eléctricos o equipos de electrónica de potencia es para poder funcionar, sin embargo, ocupan espacio dentro de la capacidad de transmisión de los conductores eléctricos, es por ello que hay que reducir dicho flujo a lo necesario que es la potencia activa, sin embargo, no puede ser sólo energía activa, dado que se entrar en una resonancia, pero si bien se puede trabajar en un factor de potencia lo más cercano a 1, pero no tanto que el sistema de control no lo pueda coordinar bien. La figura muestra una simulación del trabajo de un banco de condensadores, se puede apreciar tanto la potencia reactiva solicitada por la red eléctrica como la que brinda el banco de condensadores, ambos lo bastante cercanos que las curvas se parecen suporponer. Hecho en Matlab de MathWorks Inc para todos los interesados en los sistemas eléctricos y en el manejo adecuado del factor de potencia.
The information related to this post for sale for US $ 100.00. You can make payments through PayPal account: jorgemirez2002@gmail.com or send an e-mail to receive PayPal invoice and make your payment quickly and easily. Tell us (through e-mail) the name of the input or inputs that interests you. // La información relacionada con este post en venta por US $ 100.00. Usted puede hacer pagos a través de cuenta PayPal: jorgemirez2002@gmail.com o enviar un e-mail para recibir la factura de PayPal y hacer su pago de forma rápida y sencilla. Díganos (por medio de email) el nombre de la entrada o entradas que le interese.
Dr. Jorge Luis Mírez Tarrillo
Group of Mathematical Modeling and Numerical Simulation (GMMNS).
Universidad Nacional de Ingeniería. Lima, Perú.
E-mail: jmirez@uni.edu.pe
Website Personal: https://jorgemirez2002.wixsite.com/jorgemirez
Facebook http://www.facebook.com/jorgemirezperu
Linkedin https://www.linkedin.com/in/jorge-luis-mirez-tarrillo-94918423/
Scopus ID: https://www.scopus.com/authid/detail.uri?authorId=56488109800
Google Scholar: https://scholar.google.com/citations?user=_dSpp4YAAAAJ
MATLAB Group Admin in Facebook: https://www.facebook.com/groups/Matlab.Simulink.for.All
WhatsApp Channel/Canal: https://whatsapp.com/channel/0029VbCvpZsAYlUSz2esek2y
Blog in ENGLISH

Compra/Buy – Haz una donación/Make a donation

Dear reader, if you wish to make a donation or are interested in any information or code, please contact me (e-mail: jmirez@uni.edu.pe). Donations will allow you to continue studying and researching, and also to provide more information on this blog. My PayPal account is jorgemirez2002@gmail.com or if it is by bank transfer write to my email jmirez@uni.edu.pe. Any amount of money is welcome. Thank you.
Estimado lector, si desean hacer una donación o le interesa alguna información o código, favor ponerse en contacto con mi persona (e-mail: jmirez@uni.edu.pe). Las donaciones va a permitir seguir estudiando e investigando, y además, el poder brindar más información en este blog. Mi cuenta en PayPal es jorgemirez2002@gmail.com o si es por transferencia bancaria escribirme a mi correo jmirez@uni.edu.pe. Cualquier cantidad de dinero es bienvenido. Gracias.
Datos Generales
Good day. My full name is Jorge Luis MIREZ TARRILLO.
I am Peruvian and live in Lima, capital of Perú in South America.I am Mechanical Electrical Engineering, MSc Physics and Dr. Physics (title doctoral thesis: Control, Optimization, and Management of Microgrid Current Direct)
Too, actually job as Principal Professor in Faculty of Oil, Gas and Petrochemical Engineering of Universidad Nacional de Ingeniería (National University of Engineering) in Lima – PERU (Courses: Modern Physics, Differential Equations and Research's Methodology)
My subjects of my interest are control, signal processing, optimization, simulation, biomedical research, smart grid, microgrid, water.
I have experience in Matlab/Simulink programming, biomedical equipment, electrical systems, renewable energies, microgrids, saturated steam systems 100 psi and organizing academic events.
Comentarios Recientes
Elementos que compon… en J506: Los elementos de un paqu… Dr. Jorge Mírez en Message by IEEE Community Dr. Jorge Mírez en J546: Simulación de campos mag… jose luis huayanay v… en Message by IEEE Community Cesar Aviles en J546: Simulación de campos mag… Dr. Jorge Mírez en J518: La herramienta pdetool d… Dr. Jorge Mírez en J496: Simulación en Matlab/Sim… Raúl Barrios Elizarr… en J496: Simulación en Matlab/Sim… jose luis huayanay v… en J518: La herramienta pdetool d… MSc. Jorge Mírez en J281: La Rosa de Vientos: Frec…
Debe estar conectado para enviar un comentario.