Archive for the ‘Distribuited Generation’ Category

A microgrid operate in state stable in this simulation made on Matlab. Each state represent a determinate time (10 minutes, 15 minutes o more o less). But during this time, la Microgrid makes calculations of energy cost dispatched for each source. The imagen is the global cost of microgrid (or similar or other electric system considering all costs). The microgrid optimizer decides in base a linear programming the connection and disconnection of each source.
Dr. Jorge Luis Mírez Tarrillo
Group of Mathematical Modeling and Numerical Simulation (GMMNS).
Universidad Nacional de Ingeniería. Lima, Perú.
E-mail: jmirez@uni.edu.pe
Website Personal: https://jorgemirez2002.wixsite.com/jorgemirez
Facebook http://www.facebook.com/jorgemirezperu
Linkedin https://www.linkedin.com/in/jorge-luis-mirez-tarrillo-94918423/
Scopus ID: https://www.scopus.com/authid/detail.uri?authorId=56488109800
Google Scholar: https://scholar.google.com/citations?user=_dSpp4YAAAAJ
MATLAB Group Admin in Facebook: https://www.facebook.com/groups/Matlab.Simulink.for.All
WhatsApp Channel/Canal: https://whatsapp.com/channel/0029VbCvpZsAYlUSz2esek2y

Microgrids are both partand beneficiariesof the smart-grid concept. Is evident thatthere are objectives
shared between microgrids and the smart-grid concept: reduce the costs of energy and the reliability, efficiency and security improvement. Also, there are benefits which are linked to the useof smart-grid technologies: the deployment ofgreen technologies, different levels of quality and the use of demand response strategies
Source:
René B. Martínez-Cid. «Renewable-Driven Microgrids in Isolated Communities». A thesis submitted in partial fulfillment of the requirements for the degree of Master of Science in Electrical Engineering. University of Puerto Rico. Mayagüez Campus. 2009.
Dr. Jorge Luis Mírez Tarrillo
Group of Mathematical Modeling and Numerical Simulation (GMMNS).
Universidad Nacional de Ingeniería. Lima, Perú.
E-mail: jmirez@uni.edu.pe
Website Personal: https://jorgemirez2002.wixsite.com/jorgemirez
Facebook http://www.facebook.com/jorgemirezperu
Linkedin https://www.linkedin.com/in/jorge-luis-mirez-tarrillo-94918423/
Scopus ID: https://www.scopus.com/authid/detail.uri?authorId=56488109800
Google Scholar: https://scholar.google.com/citations?user=_dSpp4YAAAAJ
MATLAB Group Admin in Facebook: https://www.facebook.com/groups/Matlab.Simulink.for.All
WhatsApp Channel/Canal: https://whatsapp.com/channel/0029VbCvpZsAYlUSz2esek2y

One of the most promising applications of renewable energy technology is the installation of hybrid
energy systems (HES) in remote areas, where the grid extension is costly and the cost of fuel increases drastically with the remoteness of the location. Recent research have shown that HES have an excellent potential, as a form of supplementary contribution to conventional power generation systems. In figure, one of the most common hybrid renewable system implemented and studied is described.
Source:
Francisco Goncalves Goina Mesquita. «Design Optimization of Stand-Alone Hybrid Energy Systems». A Dissertation submitted under the scope of Mestrado Integrado em Engenharia Electrotécnica e de Computadores Major Energia. Fevereiro de 2010. Facultade de Engenharia da Universidade do Porto.
Dr. Jorge Luis Mírez Tarrillo
Group of Mathematical Modeling and Numerical Simulation (GMMNS).
Universidad Nacional de Ingeniería. Lima, Perú.
E-mail: jmirez@uni.edu.pe
Website Personal: https://jorgemirez2002.wixsite.com/jorgemirez
Facebook http://www.facebook.com/jorgemirezperu
Linkedin https://www.linkedin.com/in/jorge-luis-mirez-tarrillo-94918423/
Scopus ID: https://www.scopus.com/authid/detail.uri?authorId=56488109800
Google Scholar: https://scholar.google.com/citations?user=_dSpp4YAAAAJ
MATLAB Group Admin in Facebook: https://www.facebook.com/groups/Matlab.Simulink.for.All
WhatsApp Channel/Canal: https://whatsapp.com/channel/0029VbCvpZsAYlUSz2esek2y

The figure shows the minimum requirements for a VPP: a number of small participants (consumers or DERs); a communications network (the internet or dedicated lines); a communication platform with a common information model and a consensus on the communication architecture; a primary energy supply network; and a link to the energy market. The primary energy supply is the foundation of the VPP, the communication system forms the glue holding the VPP together, and the market link is the incentive which drives the system to service the needs of its owners and customers.A VPP may be dispersed over a large area, though in the case of islands and other microgrids it may equally well have tight geographical limits.
Source:
Riso Energy Report 8. “The intelligent energy system infraestructure for the future”. Riso National Laboratory. Technical University of Denmark. September 2009. ISBN 978-87-550-3754-0
Dr. Jorge Luis Mírez Tarrillo
Group of Mathematical Modeling and Numerical Simulation (GMMNS).
Universidad Nacional de Ingeniería. Lima, Perú.
E-mail: jmirez@uni.edu.pe
Website Personal: https://jorgemirez2002.wixsite.com/jorgemirez
Facebook http://www.facebook.com/jorgemirezperu
Linkedin https://www.linkedin.com/in/jorge-luis-mirez-tarrillo-94918423/
Scopus ID: https://www.scopus.com/authid/detail.uri?authorId=56488109800
Google Scholar: https://scholar.google.com/citations?user=_dSpp4YAAAAJ
MATLAB Group Admin in Facebook: https://www.facebook.com/groups/Matlab.Simulink.for.All
WhatsApp Channel/Canal: https://whatsapp.com/channel/0029VbCvpZsAYlUSz2esek2y

In Europe this growth is driven by both national and EU policies. By 2008 the EU member states had adopted longterm targets in three different areas of energy policy:
• a binding reduction in greenhouse gas emissions of 20% by 2020 compared to 1990; this target can be raised to 30% subject to the conclusion of binding international climate change agreements;
• a mandatory target for renewable energy sources such as wind, solar and biomass, which by 2020 must supply 20% of the EU’s final energy demand; and
• a voluntary agreement to cut EU energy consumption by 20% by 2020, compared to a reference projection.
The EU has also set a target of 10% renewable energy, including biofuels, in transport by 2020.
This new policy, with its increasing reliance on renewable sources, will change European energy systems radically within the next decade. Energy technologies based on variable sources, especially wind power but to a lesser extent also wave power and PV, are expected to play a large role in the future energy supply. For example, by 2020 wind power is expected to supply 50% of the Danish electricity consumption – implying that from time to time significantly more wind power will be available than Denmark can consume1. This challenge will require not only significant changes in energy system structure, but also the development of intelligence within the system
Source:
Riso Energy Report 8. “The intelligent energy system infraestructure for the future”. Riso National Laboratory. Technical University of Denmark. September 2009. ISBN 978-87-550-3754-0
Dr. Jorge Luis Mírez Tarrillo
Group of Mathematical Modeling and Numerical Simulation (GMMNS).
Universidad Nacional de Ingeniería. Lima, Perú.
E-mail: jmirez@uni.edu.pe
Website Personal: https://jorgemirez2002.wixsite.com/jorgemirez
Facebook http://www.facebook.com/jorgemirezperu
Linkedin https://www.linkedin.com/in/jorge-luis-mirez-tarrillo-94918423/
Scopus ID: https://www.scopus.com/authid/detail.uri?authorId=56488109800
Google Scholar: https://scholar.google.com/citations?user=_dSpp4YAAAAJ
MATLAB Group Admin in Facebook: https://www.facebook.com/groups/Matlab.Simulink.for.All
WhatsApp Channel/Canal: https://whatsapp.com/channel/0029VbCvpZsAYlUSz2esek2y

A study of the potential savings in energy used for heating of existing domestic buildings in Denmark has shown that savings of 60-80% in the period up to 2050 are possible if extensive energy conservation measures are put in place whenever the buildings are renovated (see Figure). The assumption is that during this period the entire building stock is either replaced by new buildings or renovated to the energy standards of new buildings. This would cut Denmark’s total final energy consumption by around 30%. A major part of these savings up to 2050 come from renovation…
Source:
Riso Energy Report 6. “Future options for energy technologies”. Riso National Laboratory. Technical University of Denmark. November 2007. ISBN 978-87-550-3611-6
Dr. Jorge Luis Mírez Tarrillo
Group of Mathematical Modeling and Numerical Simulation (GMMNS).
Universidad Nacional de Ingeniería. Lima, Perú.
E-mail: jmirez@uni.edu.pe
Website Personal: https://jorgemirez2002.wixsite.com/jorgemirez
Facebook http://www.facebook.com/jorgemirezperu
Linkedin https://www.linkedin.com/in/jorge-luis-mirez-tarrillo-94918423/
Scopus ID: https://www.scopus.com/authid/detail.uri?authorId=56488109800
Google Scholar: https://scholar.google.com/citations?user=_dSpp4YAAAAJ
MATLAB Group Admin in Facebook: https://www.facebook.com/groups/Matlab.Simulink.for.All
WhatsApp Channel/Canal: https://whatsapp.com/channel/0029VbCvpZsAYlUSz2esek2y

Denmark is the only net exporter of energy in the EU. In 2005, production from Danish oil and gas fields in the North sea exceeded the country’s gross energy consumption by 56%. At the same time Denmark has an environmentally-friendly energy profile that includes considerable amounts of renewable energy, especially wind power; strong energy efficiency measures; and widespread use of combined heat and power (CHP). For more than 20 years Denmark has kept its gross energy consumption almost constant, with an increase of just 4% since 1985, despite a 70% increase in gross national product in the same period. In short, Denmark is in a far better energy situation than most countries in the EU
Source:
Riso Energy Report 6. «Future options for energy technologies». Riso National Laboratory. Technical University of Denmark. November 2007. ISBN 978-87-550-3611-6
Dr. Jorge Luis Mírez Tarrillo
Group of Mathematical Modeling and Numerical Simulation (GMMNS).
Universidad Nacional de Ingeniería. Lima, Perú.
E-mail: jmirez@uni.edu.pe
Website Personal: https://jorgemirez2002.wixsite.com/jorgemirez
Facebook http://www.facebook.com/jorgemirezperu
Linkedin https://www.linkedin.com/in/jorge-luis-mirez-tarrillo-94918423/
Scopus ID: https://www.scopus.com/authid/detail.uri?authorId=56488109800
Google Scholar: https://scholar.google.com/citations?user=_dSpp4YAAAAJ
MATLAB Group Admin in Facebook: https://www.facebook.com/groups/Matlab.Simulink.for.All
WhatsApp Channel/Canal: https://whatsapp.com/channel/0029VbCvpZsAYlUSz2esek2y

Community/Utility Microgrids:The word “community” implies a geographical region that includes residential customers. Most observers predict that this class of microgrids will not achieve widespread commercial acceptance until standards are in place and regulatory barriers are removed.
Commercial/Industrial:The first “modern” industrial microgrid in the United States was a 64 MW facility constructed in 1955 at the Whitling Refinery in Indiana. All told, 455 megawatts (MW) of these vintage microgrids are currently online in the United States. Unlike today’s conceptual state-of-the-art models, these initial designs for the petrochemical industry still feature centralizedcontrols and fossil-fueled generation sets. Japan is a modern leader in the commercial/industrial sector, though most of its microgrids include governmental and other institutional customers.
Institutional/Campus:Because of the advantage of common ownership, this class of microgrids offers the best near-term development opportunity. At present, 322 MW of college campus microgrids are up and running in the United States, with more sophisticated state-of-the-art microgrids on the drawing boards. In the U.S., 40% of future microgrids will be developed in this market segment, adding 940 MW of new
capacity valued at $2.76 billion by 2015.
Remote Off-Grid Systems:This segment represents the greatest number of microgrids currently operating globally, but it has the smallest average capacity. While many systems have historically featured diesel distributed energy generation (DEG), the largest growth sector is solar photovoltaics (PV). Small wind is projected to play a growing role, as well.
Military Microgrids:The smallest market segment, these microgrids are just now being developed. They are integrating Renewable Distributed Energy Generation (RDEG) as a way to secure power supply without being dependent on any supplied fuel. GE and Sandia are moving forward in this area and model prototypes are expected in 2010.
Source:
Peter Asmus. Adam Cornelus. Clint Wheelock. «Microgrids: Islanded Power Grids and Distributed Generation for Community, Commercial, and Institutional Apllications». Research Report. PikeResearch. 2009.
Dr. Jorge Luis Mírez Tarrillo
Group of Mathematical Modeling and Numerical Simulation (GMMNS).
Universidad Nacional de Ingeniería. Lima, Perú.
E-mail: jmirez@uni.edu.pe
Website Personal: https://jorgemirez2002.wixsite.com/jorgemirez
Facebook http://www.facebook.com/jorgemirezperu
Linkedin https://www.linkedin.com/in/jorge-luis-mirez-tarrillo-94918423/
Scopus ID: https://www.scopus.com/authid/detail.uri?authorId=56488109800
Google Scholar: https://scholar.google.com/citations?user=_dSpp4YAAAAJ
MATLAB Group Admin in Facebook: https://www.facebook.com/groups/Matlab.Simulink.for.All
WhatsApp Channel/Canal: https://whatsapp.com/channel/0029VbCvpZsAYlUSz2esek2y

Inthe recent past, dramatic improvements in productivity have been realized in the high technology sector as well as in the traditional industries. For the electric power supply to these industries, this hasled to a concomitant increase in the number of loads that are sensitive to power quality. Some of the industries that have such large sensitive loads include semiconductor manufacturing, textile mills, paper millsand plastic injection molding.Of course, a number of smaller but equally critical loads such as computers and electronic data processing equipment are also sensitive to power quality.Thetolerance
levels of computer equipment are specified by the Information Technology Industry/Computer and Business Equipment Manufacturers’ Association (ITI/CBEMA) curves. Figure illustrates theCBEMA curves. This figure gives thepercent of nominal voltage versus duration in (60-Hz) cycles. The CBEMA curves represent the boundary of the ac input voltage envelope that can be tolerated (typically) by most
computer-based equipment. The upper curve represents the maximum voltage below which the equipment will continue to function normally. The lower curve is the minimum voltage above which the equipment will continue to function normally.
As seen in Figure, the steady state range of tolerance for computer equipmentis ±10% from the nominal voltage, i.e., the equipment continues to operate normally when sourced by any voltages in this range for an indefinite period of time. Similarly, voltages wells to a magnitude of 120% of the nominal value can be tolerated for about 0.5 s or 30 cycles; voltage sags to 80% of nominal for 10 s, or 600 cycles, can be tolerated. When the supply voltage is outside the boundaries of the susceptibility curves, improvement of the quality of power supplied to sensitive loads is essential to avoid a possible failure in their operation.
Source:
G. Venkataramanan, M.S. Illindala, C. Houle, and R.H. Lasseter. «Hardware Development of a Laboratory-Scale Microgrid Phase 1—Single Inverter in Island Mode Operation». NREL. November 2002 • NREL/SR-560-32527
Dr. Jorge Luis Mírez Tarrillo
Group of Mathematical Modeling and Numerical Simulation (GMMNS).
Universidad Nacional de Ingeniería. Lima, Perú.
E-mail: jmirez@uni.edu.pe
Website Personal: https://jorgemirez2002.wixsite.com/jorgemirez
Facebook http://www.facebook.com/jorgemirezperu
Linkedin https://www.linkedin.com/in/jorge-luis-mirez-tarrillo-94918423/
Scopus ID: https://www.scopus.com/authid/detail.uri?authorId=56488109800
Google Scholar: https://scholar.google.com/citations?user=_dSpp4YAAAAJ
MATLAB Group Admin in Facebook: https://www.facebook.com/groups/Matlab.Simulink.for.All
WhatsApp Channel/Canal: https://whatsapp.com/channel/0029VbCvpZsAYlUSz2esek2y

One question that most system operators are concerned with is the optimised DG penetration level. Relationship regarding different cost models between optimum DG penetration level and interruption frequency is indicated in Figure.
Optimum micro-source penetration level is positive related with the interruption frequency without DG penetration; especially for average interruption costs, the relationship is almost linear. This relationship is important for systemplanning; as the system interruption frequency without DG penetration is generally known, the system operator is able to roughly determine of the optimum DG penetration level from reliability point of view
Dr. Jorge Luis Mírez Tarrillo
Group of Mathematical Modeling and Numerical Simulation (GMMNS).
Universidad Nacional de Ingeniería. Lima, Perú.
E-mail: jmirez@uni.edu.pe
Website Personal: https://jorgemirez2002.wixsite.com/jorgemirez
Facebook http://www.facebook.com/jorgemirezperu
Linkedin https://www.linkedin.com/in/jorge-luis-mirez-tarrillo-94918423/
Scopus ID: https://www.scopus.com/authid/detail.uri?authorId=56488109800
Google Scholar: https://scholar.google.com/citations?user=_dSpp4YAAAAJ
MATLAB Group Admin in Facebook: https://www.facebook.com/groups/Matlab.Simulink.for.All
WhatsApp Channel/Canal: https://whatsapp.com/channel/0029VbCvpZsAYlUSz2esek2y

A reduction of system unavailability Q, as one example for system reliability indices, by the installation of micro-sources that enable (partial) island operation is demonstrated in Figure for selected European countries, compared to the case without DG.
The countries which have worse system reliability achieve higher improvements than the countries with high system reliabilities also in case without DG. For instance, in Portugal rural network the system unavailability decreases from more than 10 h/a to the value of below 1 h/a with maximum and average cost model; even with average cost model yearly unavailability is also reduced to approximate 4h/a. However, the improvement for German urban network and Holland network, which have already good system reliability without micro-sources, is not obvious, although system reliability is also improved to a certain extent in both networks. With higher interruption cost model, system reliability can be better improved. Higher interruption costs justify higher micro-source investment, thus achieving higher system reliability improvements. Microgrid operation from reliability point of view is thus most beneficial in countries with lower power quality or in regions or for customer segments with comparably high outage costs.
Source:
Christine Schwaegerl. “DG3&DG4 Report on the technical, social, economic, and environmental benefits provided by Microgrids on power system operation”. Siemens AG. 2009
Dr. Jorge Luis Mírez Tarrillo
Group of Mathematical Modeling and Numerical Simulation (GMMNS).
Universidad Nacional de Ingeniería. Lima, Perú.
E-mail: jmirez@uni.edu.pe
Website Personal: https://jorgemirez2002.wixsite.com/jorgemirez
Facebook http://www.facebook.com/jorgemirezperu
Linkedin https://www.linkedin.com/in/jorge-luis-mirez-tarrillo-94918423/
Scopus ID: https://www.scopus.com/authid/detail.uri?authorId=56488109800
Google Scholar: https://scholar.google.com/citations?user=_dSpp4YAAAAJ
MATLAB Group Admin in Facebook: https://www.facebook.com/groups/Matlab.Simulink.for.All
WhatsApp Channel/Canal: https://whatsapp.com/channel/0029VbCvpZsAYlUSz2esek2y

In addition to economic benefits, other motivations helping to drive the transition toward small-scale, decentralized energy systems include increased concern for environmental impacts of generation, most especially those related to climate change, increased concern for the vulnerability of our centralized energy systems to terrorist attacks, and increased demands for electricity reliability in the digital economy.
A sense of the dramatic decrease in scale that is underway is provided in Table (top), in which a number of generation technologies are listed along with typical power outputs. For comparison, some examples of power demands of typical end uses are also shown. While the power ratings of some of the distributed generation options may look trivially small, it is the potentially large numbers of replicated small units that will make their contribution significant. For example, the U.S. auto industry builds around 6 million cars each year. If half of those were 60-kW fuel-cell vehicles, the combined generation capacity of
5-year’s worth of automobile production would be greater than the total installed capacity of all U.S. power plants.
Source:
Gilbert M. Masters. “Renewable and Efficient Electric Power Systems”. Jhon Wiley & Sons, Inc., New Jersey. ISBN 0-471-28060-7. 2004
Dr. Jorge Luis Mírez Tarrillo
Group of Mathematical Modeling and Numerical Simulation (GMMNS).
Universidad Nacional de Ingeniería. Lima, Perú.
E-mail: jmirez@uni.edu.pe
Website Personal: https://jorgemirez2002.wixsite.com/jorgemirez
Facebook http://www.facebook.com/jorgemirezperu
Linkedin https://www.linkedin.com/in/jorge-luis-mirez-tarrillo-94918423/
Scopus ID: https://www.scopus.com/authid/detail.uri?authorId=56488109800
Google Scholar: https://scholar.google.com/citations?user=_dSpp4YAAAAJ
MATLAB Group Admin in Facebook: https://www.facebook.com/groups/Matlab.Simulink.for.All
WhatsApp Channel/Canal: https://whatsapp.com/channel/0029VbCvpZsAYlUSz2esek2y
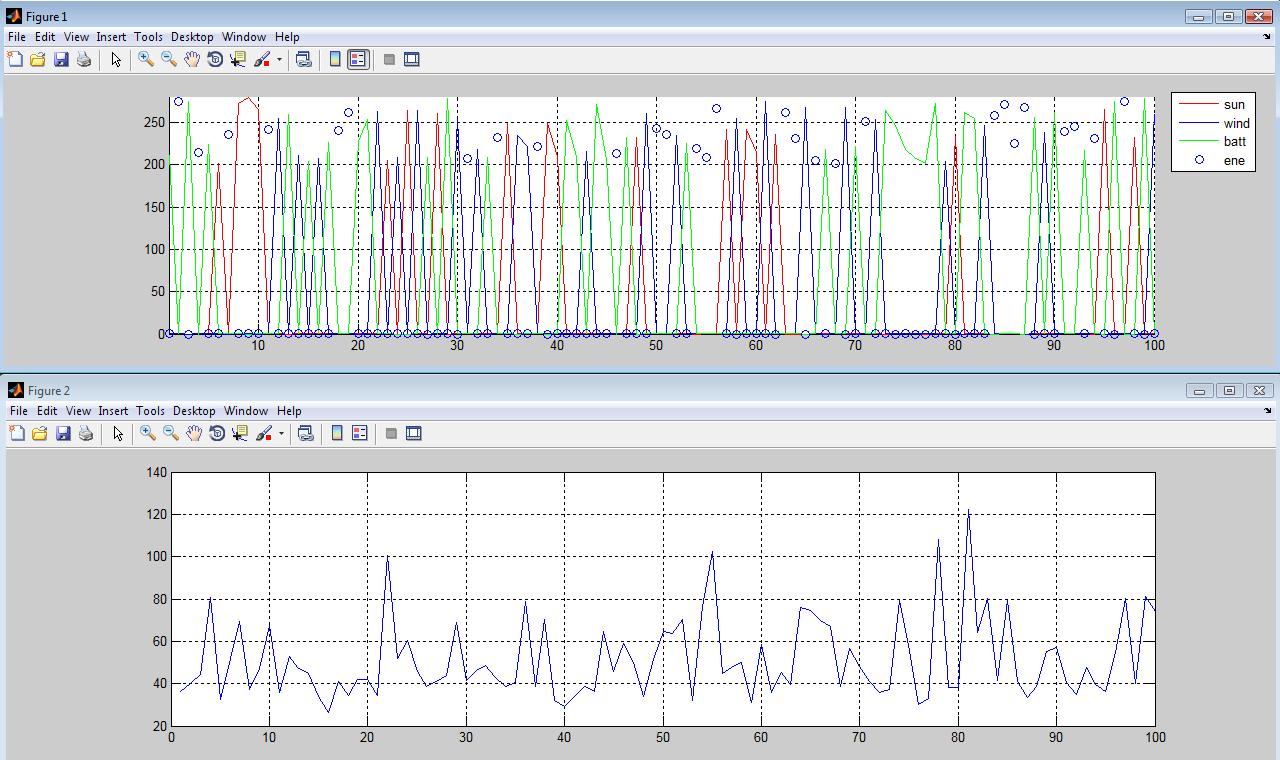
Usually the microgrid used wind turbine (wind), PV (sun), battery (batt) and load, aditional it have a PCC with electrical network external (ene). Both the technical operation as the economic operation are important during performance microgrid. In the figure I show the results of optimization process with imaginary energy prices from diferent source mentioned. In top figure is the power distribution between sources and down figure the total cost of each state. Programming linear has been used in this modelling and simulations.
Dr. Jorge Luis Mírez Tarrillo
Group of Mathematical Modeling and Numerical Simulation (GMMNS).
Universidad Nacional de Ingeniería. Lima, Perú.
E-mail: jmirez@uni.edu.pe
Website Personal: https://jorgemirez2002.wixsite.com/jorgemirez
Facebook http://www.facebook.com/jorgemirezperu
Linkedin https://www.linkedin.com/in/jorge-luis-mirez-tarrillo-94918423/
Scopus ID: https://www.scopus.com/authid/detail.uri?authorId=56488109800
Google Scholar: https://scholar.google.com/citations?user=_dSpp4YAAAAJ
MATLAB Group Admin in Facebook: https://www.facebook.com/groups/Matlab.Simulink.for.All
WhatsApp Channel/Canal: https://whatsapp.com/channel/0029VbCvpZsAYlUSz2esek2y
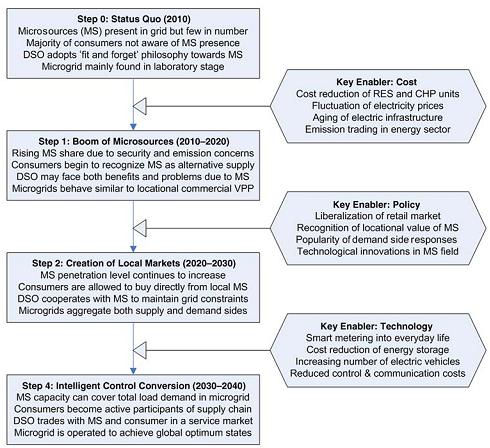
Currently, an increasing number of microgrid pilot sites can be observed in many parts of the world. It is true, however, that up to now,cost, policy and technology barriers have largely restrained the wide deployment of microgrids in distribution networks owing to their limited commercial appeal or social recognition. However, these three barriers are currently undergoing considerable changes – they are very likely to turn into key enablers in the future, eventually leading to a widespread microgrid adoption worldwide.
Firstly, the cost factor might prove to be the most effective driving force for microgrids in the very near future. This might happen not only because of the reduction of microsource costs, but also because of the relative changes of external opportunity costs due to economic (fluctuating market prices), technical (aging of network infrastructure) and environmental (emission trading) factors.
When microsource penetration at a LV grid becomes significant, participants in the electricity retail business will consider the aggregated power from small generators as a new market opportunity. Unlike in the case of VPP, microgrid stakeholders will eventually recognize a unique feature of aggregated microsource units, namely locality: the microsource units can potentially sell directly to end consumers in an “over-the-grid” manner. In order to turn this potential into reality, however, the second factor – appropriate policy and regulatory environment – is needed to enable the operation of a local market within a microgrid.
Finally, the adoption of favorable selling prices in local retail markets will attract even more microsource units, allowing the microgrid to operate islanded, if beneficial. With the help of smart metering, control and communication technologies, the microgrid operator will eventually be able to coordinate a large consortium of intermittent and controllable microsource units, as well as central and distributed storage devices, to achieve multiple objectives and, at the same time, to cater for the interests of different stakeholders.
Source:
MICROGRIDS: Architectures and Control
Nikos Hatziargynou
Dr. Jorge Luis Mírez Tarrillo
Group of Mathematical Modeling and Numerical Simulation (GMMNS).
Universidad Nacional de Ingeniería. Lima, Perú.
E-mail: jmirez@uni.edu.pe
Website Personal: https://jorgemirez2002.wixsite.com/jorgemirez
Facebook http://www.facebook.com/jorgemirezperu
Linkedin https://www.linkedin.com/in/jorge-luis-mirez-tarrillo-94918423/
Scopus ID: https://www.scopus.com/authid/detail.uri?authorId=56488109800
Google Scholar: https://scholar.google.com/citations?user=_dSpp4YAAAAJ
MATLAB Group Admin in Facebook: https://www.facebook.com/groups/Matlab.Simulink.for.All
WhatsApp Channel/Canal: https://whatsapp.com/channel/0029VbCvpZsAYlUSz2esek2y
FACTS devices can enhance the power flow on existing power lines. For the transmission line shown in figure, the sending end voltage isVS∠δS, the receiving end voltage is VR∠δR and the equivalent impedance of parallel connected lines isX. The power transfer through the lines is given by:

the figure also shows how FACTS devices act on the power transfer equation. The TCSC can change the impedance of the line, the STATCOM can control the voltage magnitude at

the terminal to which it is connected by injecting or absorbing reactive power and the UPFC can alter the phase angle of the sending end voltage, thus power flow through a line can be controlled in a number of ways.
Source:
SMART GRID
TECHNOLOGY AND APPLICATIONS
Janaka Ekanayake
Cardiff University, UK
Kithsiri Liyanage
University of Peradeniya, Sri Lanka
Jianzhong Wu
Cardiff University, UK
Akihiko Yokoyama
University of Tokyo, Japan
Nick Jenkins
Cardiff University, UK
A John Wiley & Sons, Ltd., Publication
Dr. Jorge Luis Mírez Tarrillo
Group of Mathematical Modeling and Numerical Simulation (GMMNS).
Universidad Nacional de Ingeniería. Lima, Perú.
E-mail: jmirez@uni.edu.pe
Website Personal: https://jorgemirez2002.wixsite.com/jorgemirez
Facebook http://www.facebook.com/jorgemirezperu
Linkedin https://www.linkedin.com/in/jorge-luis-mirez-tarrillo-94918423/
Scopus ID: https://www.scopus.com/authid/detail.uri?authorId=56488109800
Google Scholar: https://scholar.google.com/citations?user=_dSpp4YAAAAJ
MATLAB Group Admin in Facebook: https://www.facebook.com/groups/Matlab.Simulink.for.All
WhatsApp Channel/Canal: https://whatsapp.com/channel/0029VbCvpZsAYlUSz2esek2y

The communication infrastructure of a power system typically consists of SCADA systems with dedicated communication channels to and from the System Control Centre and a Wide Area Network (WAN). Some long-established power utilities may have private telephone networks and other legacy communication systems. The SCADA systems connect all the major power system operational facilities, that is, the central generating stations, the transmission grid substations and the primary distribution substations to the System Control Centre. The WAN is used for corporate business and market operations. These form the core communication networks of the traditional power system. However, in the Smart Grid,it is expected that these two elements of communication infrastructure will merge into a Utility WAN.
An essential development of the Smart Grid (see figure ) is to extend communication throughout the distribution system and to establish two-way communications with customers through Neighbourhood Area Networks (NANs) covering the areas served by distribution substations. Customers’ premises will have Home Area Networks (HANs). The interface of the Home and Neighbourhood Area Networks will be through a smart meter or smart interfacing device.
Source:
SMART GRID
TECHNOLOGY AND APPLICATIONS
Janaka Ekanayake
Cardiff University, UK
Kithsiri Liyanage
University of Peradeniya, Sri Lanka
Jianzhong Wu
Cardiff University, UK
Akihiko Yokoyama
University of Tokyo, Japan
Nick Jenkins
Cardiff University, UK
A John Wiley & Sons, Ltd., Publication
Dr. Jorge Luis Mírez Tarrillo
Group of Mathematical Modeling and Numerical Simulation (GMMNS).
Universidad Nacional de Ingeniería. Lima, Perú.
E-mail: jmirez@uni.edu.pe
Website Personal: https://jorgemirez2002.wixsite.com/jorgemirez
Facebook http://www.facebook.com/jorgemirezperu
Linkedin https://www.linkedin.com/in/jorge-luis-mirez-tarrillo-94918423/
Scopus ID: https://www.scopus.com/authid/detail.uri?authorId=56488109800
Google Scholar: https://scholar.google.com/citations?user=_dSpp4YAAAAJ
MATLAB Group Admin in Facebook: https://www.facebook.com/groups/Matlab.Simulink.for.All
WhatsApp Channel/Canal: https://whatsapp.com/channel/0029VbCvpZsAYlUSz2esek2y

The figure shows the DMSC controller building blocks that assess operating conditions and find the control settings for devices connected to the network. The key functions of the DMSC are state estimation, bad data detection and the calculation of optimal control settings. The DMSC receives a limited number of real-time measurements at set intervals from the network nodes. The measurements are normally voltage, load injections and power flow measurements from the primary substation and other secondary substations. These measurements are used to calculate the network operating conditions. In addition to these real-time measurements, the DMSC uses load models to forecast load injections at each node on the network for a given period that coincides with the real-time measurements. The network topology and impedances are also supplied to the DMSC.
The state estimator uses this data to assess the network conditions in terms of node voltage magnitudes, line power flows and network injections. Bad measurements coming to the system will be filtered using bad data detection and identification methods.
Source:
SMART GRID
TECHNOLOGY AND APPLICATIONS
Janaka Ekanayake
Cardiff University, UK
Kithsiri Liyanage
University of Peradeniya, Sri Lanka
Jianzhong Wu
Cardiff University, UK
Akihiko Yokoyama
University of Tokyo, Japan
Nick Jenkins
Cardiff University, UK
A John Wiley & Sons, Ltd., Publication
Dr. Jorge Luis Mírez Tarrillo
Group of Mathematical Modeling and Numerical Simulation (GMMNS).
Universidad Nacional de Ingeniería. Lima, Perú.
E-mail: jmirez@uni.edu.pe
Website Personal: https://jorgemirez2002.wixsite.com/jorgemirez
Facebook http://www.facebook.com/jorgemirezperu
Linkedin https://www.linkedin.com/in/jorge-luis-mirez-tarrillo-94918423/
Scopus ID: https://www.scopus.com/authid/detail.uri?authorId=56488109800
Google Scholar: https://scholar.google.com/citations?user=_dSpp4YAAAAJ
MATLAB Group Admin in Facebook: https://www.facebook.com/groups/Matlab.Simulink.for.All
WhatsApp Channel/Canal: https://whatsapp.com/channel/0029VbCvpZsAYlUSz2esek2y

The present post describe the charge and discharge process of a battery bank of a microgrid. This microgrid have a aleatory voltage with inferior and superior limit. The current and electric power of charge and discharge is in picture. This simulation has writing and processing on Matlab/Simulink of MathaWorth Inc. Actually my interest is the control, optimization and management of microgrid DC. Greetings from Perú.
The information related to this post for sale for US $ 1000.00. You can make payments through PayPal account: jorgemirez2002@gmail.com or send an e-mail to receive PayPal invoice and make your payment quickly and easily. Tell us (through e-mail) the name of the input or inputs that interests you. // La información relacionada con este post en venta por US $ 1000.00. Usted puede hacer pagos a través de cuenta PayPal: jorgemirez2002@gmail.com o enviar un e-mail para recibir la factura de PayPal y hacer su pago de forma rápida y sencilla. Díganos (por medio de email) el nombre de la entrada o entradas que le interese.
Dr. Jorge Luis Mírez Tarrillo
Group of Mathematical Modeling and Numerical Simulation (GMMNS).
Universidad Nacional de Ingeniería. Lima, Perú.
E-mail: jmirez@uni.edu.pe
Website Personal: https://jorgemirez2002.wixsite.com/jorgemirez
Facebook http://www.facebook.com/jorgemirezperu
Linkedin https://www.linkedin.com/in/jorge-luis-mirez-tarrillo-94918423/
Scopus ID: https://www.scopus.com/authid/detail.uri?authorId=56488109800
Google Scholar: https://scholar.google.com/citations?user=_dSpp4YAAAAJ
MATLAB Group Admin in Facebook: https://www.facebook.com/groups/Matlab.Simulink.for.All
WhatsApp Channel/Canal: https://whatsapp.com/channel/0029VbCvpZsAYlUSz2esek2y

Cargas residenciales o domiciliarias, dado que tienen el mismo comportamiento junto con las cargas comerciales son simuladas en Matlab/Simulink de MathWork Inc. y los resultados se muestran en el presente post. Se ha considerado un tiempo de simulación de 72 horas, para el cual se ha cargado los datos de registro de ambos tipos de cargas. Sirve como parte de un sistema mucho más grande en que las cargas eléctricas son una parte de los equipos y elementos que lo constituyen. Estamos hablando de redes de distribución o también microredes. Uno de los problemas que se tiene a simular es calibrar el eje horizontal a la escala de tiempo de simulación, dado que Matlab/Simulink cuenta estados, esta cantidad de estados resueltos por las ecuaciones tiene que luego ser escalados al tiempo de simulación. Redes eléctricas, microredes y SmartGrid son las cosas que me interesan.
The information related to this post for sale for US $ 50.00. You can make payments through PayPal account: jorgemirez2002@gmail.com or send an e-mail to receive PayPal invoice and make your payment quickly and easily. Tell us (through e-mail) the name of the input or inputs that interests you. // La información relacionada con este post en venta por US $ 50.00. Usted puede hacer pagos a través de cuenta PayPal: jorgemirez2002@gmail.com o enviar un e-mail para recibir la factura de PayPal y hacer su pago de forma rápida y sencilla. Díganos (por medio de email) el nombre de la entrada o entradas que le interese.
Dr. Jorge Luis Mírez Tarrillo
Group of Mathematical Modeling and Numerical Simulation (GMMNS).
Universidad Nacional de Ingeniería. Lima, Perú.
E-mail: jmirez@uni.edu.pe
Website Personal: https://jorgemirez2002.wixsite.com/jorgemirez
Facebook http://www.facebook.com/jorgemirezperu
Linkedin https://www.linkedin.com/in/jorge-luis-mirez-tarrillo-94918423/
Scopus ID: https://www.scopus.com/authid/detail.uri?authorId=56488109800
Google Scholar: https://scholar.google.com/citations?user=_dSpp4YAAAAJ
MATLAB Group Admin in Facebook: https://www.facebook.com/groups/Matlab.Simulink.for.All
WhatsApp Channel/Canal: https://whatsapp.com/channel/0029VbCvpZsAYlUSz2esek2y

En esta entrada os presento un nuevo esquema ejemplo de la configuración de una microred eléctrica. Tiene constituido por carga eléctrica representado por un tablero de distribución, turbinas eólicas, una generador eléctrico, banco de baterías electrolíticas y una conexión a la red pública de electricidad. Usa el modo de distribución de corriente continua, por lo tanto, hay conversores y adecuadores de electricidad para que ésta pueda ser distribuida adecuadamente (soy un convencido que la corriente continua tiene mucho futuro). Igualmente hay un dispositivo de electrónica de potencia como Punto de Común Acoplamiento PCC hacia la red eléctrica externa. Muchas instalaciones no existen y por lo general, hay publicaciones y tesis que se encargan de hacer modelos y simulaciones para luego en un futuro próximo cercano estos se implementen como prototipos o ya productos en el mercado. Espero que os les sirva, añadiendo además que trabajo en la construcción de estos modelos matemáticos y computacionales en Matlab/Simulink.
PD: Las entradas para el siguiente año tendrán una versión en español catalogado como lo venimos haciendo por ejemplo J901, y otra en inglés que tendrá como inicio de nombre por ejemplo J901e. Attention: Next year, this blog have inputs in english with name for example J900e, «e» of post in english language.
The information related to this post for sale for US $ 1000.00. You can make payments through PayPal account: jorgemirez2002@gmail.com or send an e-mail to receive PayPal invoice and make your payment quickly and easily. Tell us (through e-mail) the name of the input or inputs that interests you. // La información relacionada con este post en venta por US $ 1000.00. Usted puede hacer pagos a través de cuenta PayPal: jorgemirez2002@gmail.com o enviar un e-mail para recibir la factura de PayPal y hacer su pago de forma rápida y sencilla. Díganos (por medio de email) el nombre de la entrada o entradas que le interese.
Dr. Jorge Luis Mírez Tarrillo
Group of Mathematical Modeling and Numerical Simulation (GMMNS).
Universidad Nacional de Ingeniería. Lima, Perú.
E-mail: jmirez@uni.edu.pe
Website Personal: https://jorgemirez2002.wixsite.com/jorgemirez
Facebook http://www.facebook.com/jorgemirezperu
Linkedin https://www.linkedin.com/in/jorge-luis-mirez-tarrillo-94918423/
Scopus ID: https://www.scopus.com/authid/detail.uri?authorId=56488109800
Google Scholar: https://scholar.google.com/citations?user=_dSpp4YAAAAJ
MATLAB Group Admin in Facebook: https://www.facebook.com/groups/Matlab.Simulink.for.All
WhatsApp Channel/Canal: https://whatsapp.com/channel/0029VbCvpZsAYlUSz2esek2y
Blog in ENGLISH

Compra/Buy – Haz una donación/Make a donation

Dear reader, if you wish to make a donation or are interested in any information or code, please contact me (e-mail: jmirez@uni.edu.pe). Donations will allow you to continue studying and researching, and also to provide more information on this blog. My PayPal account is jorgemirez2002@gmail.com or if it is by bank transfer write to my email jmirez@uni.edu.pe. Any amount of money is welcome. Thank you.
Estimado lector, si desean hacer una donación o le interesa alguna información o código, favor ponerse en contacto con mi persona (e-mail: jmirez@uni.edu.pe). Las donaciones va a permitir seguir estudiando e investigando, y además, el poder brindar más información en este blog. Mi cuenta en PayPal es jorgemirez2002@gmail.com o si es por transferencia bancaria escribirme a mi correo jmirez@uni.edu.pe. Cualquier cantidad de dinero es bienvenido. Gracias.
Datos Generales
Good day. My full name is Jorge Luis MIREZ TARRILLO.
I am Peruvian and live in Lima, capital of Perú in South America.I am Mechanical Electrical Engineering, MSc Physics and Dr. Physics (title doctoral thesis: Control, Optimization, and Management of Microgrid Current Direct)
Too, actually job as Principal Professor in Faculty of Oil, Gas and Petrochemical Engineering of Universidad Nacional de Ingeniería (National University of Engineering) in Lima – PERU (Courses: Modern Physics, Differential Equations and Research's Methodology)
My subjects of my interest are control, signal processing, optimization, simulation, biomedical research, smart grid, microgrid, water.
I have experience in Matlab/Simulink programming, biomedical equipment, electrical systems, renewable energies, microgrids, saturated steam systems 100 psi and organizing academic events.
Comentarios Recientes
Elementos que compon… en J506: Los elementos de un paqu… Dr. Jorge Mírez en Message by IEEE Community Dr. Jorge Mírez en J546: Simulación de campos mag… jose luis huayanay v… en Message by IEEE Community Cesar Aviles en J546: Simulación de campos mag… Dr. Jorge Mírez en J518: La herramienta pdetool d… Dr. Jorge Mírez en J496: Simulación en Matlab/Sim… Raúl Barrios Elizarr… en J496: Simulación en Matlab/Sim… jose luis huayanay v… en J518: La herramienta pdetool d… MSc. Jorge Mírez en J281: La Rosa de Vientos: Frec…
Debe estar conectado para enviar un comentario.