Archive for the ‘Smart Grid’ Category

This simulation is about microgrid with solar and wind source, battery storage and utility network. It have cost differents and the simulation is para 96 time’s step. The distance between time’s step is configurable and it depend of characteristic of each source and all source in general. Made on Matlab of Math/Works Inc.
Dr. Jorge Luis Mírez Tarrillo
Group of Mathematical Modeling and Numerical Simulation (GMMNS).
Universidad Nacional de Ingeniería. Lima, Perú.
E-mail: jmirez@uni.edu.pe
Website Personal: https://jorgemirez2002.wixsite.com/jorgemirez
Facebook http://www.facebook.com/jorgemirezperu
Linkedin https://www.linkedin.com/in/jorge-luis-mirez-tarrillo-94918423/
Scopus ID: https://www.scopus.com/authid/detail.uri?authorId=56488109800
Google Scholar: https://scholar.google.com/citations?user=_dSpp4YAAAAJ
MATLAB Group Admin in Facebook: https://www.facebook.com/groups/Matlab.Simulink.for.All
WhatsApp Channel/Canal: https://whatsapp.com/channel/0029VbCvpZsAYlUSz2esek2y

Satisfaction of local consumption implies that the power produced by microgeneration is used to supply partly or wholly in-site consumption. In such a case, there is no requirement for separate metering of microsource generation (also called “net-metering”). However, on-site generation and on-site load need to be metered separately when microsource units appear as independent generators that sell all their production directly to the network and are not financially related to end consumers. In this case, local consumption is a market opportunity that can be easily overlooked by all players (see Figure). There are two main advantages of promoting local consumption satisfaction within a microgrid:
1. End consumers are provided with more choices in retail power supply.
2. Microsource operators have the possibility to obtain quasi-retail prices via selling locallyto minimize network charges.
The local retail market concept is therefore directly linked to the local consumption mechanism, which can also be seen as a two-sided hedging tool for both demand and supply players for reducing market risk: consumers can use the local market to hedge against high market price, while microsources can use the local market to hedge against low market price.
Source:
Nikos Hatziargyriou. “Microgrids Architectures and Control”. 2014 John Wiley and Sons Ltd. ISBN: 978-1-118-72068-4.
Dr. Jorge Luis Mírez Tarrillo
Group of Mathematical Modeling and Numerical Simulation (GMMNS).
Universidad Nacional de Ingeniería. Lima, Perú.
E-mail: jmirez@uni.edu.pe
Website Personal: https://jorgemirez2002.wixsite.com/jorgemirez
Facebook http://www.facebook.com/jorgemirezperu
Linkedin https://www.linkedin.com/in/jorge-luis-mirez-tarrillo-94918423/
Scopus ID: https://www.scopus.com/authid/detail.uri?authorId=56488109800
Google Scholar: https://scholar.google.com/citations?user=_dSpp4YAAAAJ
MATLAB Group Admin in Facebook: https://www.facebook.com/groups/Matlab.Simulink.for.All
WhatsApp Channel/Canal: https://whatsapp.com/channel/0029VbCvpZsAYlUSz2esek2y

In Figure, the microgrid concept is further clarified by examples that highlight three essential microgrid features: local load, local microsources and intelligent control. In many countries environmental protection is romoted by the provision of carbon credits by the use of RES and CHP technologies; this should be also added as a microgrids feature. Absence of one or more features would be better described by DG interconnection cases or DSI (Demand Side integration) case.
Source:
Nikos Hatziargyriou. “Microgrids Architectures and Control”. 2014 John Wiley and Sons Ltd. ISBN: 978-1-118-72068-4.
Dr. Jorge Luis Mírez Tarrillo
Group of Mathematical Modeling and Numerical Simulation (GMMNS).
Universidad Nacional de Ingeniería. Lima, Perú.
E-mail: jmirez@uni.edu.pe
Website Personal: https://jorgemirez2002.wixsite.com/jorgemirez
Facebook http://www.facebook.com/jorgemirezperu
Linkedin https://www.linkedin.com/in/jorge-luis-mirez-tarrillo-94918423/
Scopus ID: https://www.scopus.com/authid/detail.uri?authorId=56488109800
Google Scholar: https://scholar.google.com/citations?user=_dSpp4YAAAAJ
MATLAB Group Admin in Facebook: https://www.facebook.com/groups/Matlab.Simulink.for.All
WhatsApp Channel/Canal: https://whatsapp.com/channel/0029VbCvpZsAYlUSz2esek2y

A microgrid appears at a large variety of scales: it can be defined at the level of a LV grid, a LV feeder or a LV house – examples are given in Figure. As a microgrid grows in scale, it will likely be equipped with more balancing capacities and feature better controllability to reduce the intermittencies of load and RES. In general, the maximum capacity of a microgrid (in terms of peak load demand) is limited to few MW (at least at the European scale, other regions may have different upper limits, see Chapter 6). At higher voltage levels, multimicrogrid concepts are applied, implying the coordination of interconnected, but separate microgrids in collaboration with upstream connected DGs and MV network controls. The operation of multi-microgrids)…
Source:
Nikos Hatziargyriou. “Microgrids Architectures and Control”. 2014 John Wiley and Sons Ltd. ISBN: 978-1-118-72068-4.
Dr. Jorge Luis Mírez Tarrillo
Group of Mathematical Modeling and Numerical Simulation (GMMNS).
Universidad Nacional de Ingeniería. Lima, Perú.
E-mail: jmirez@uni.edu.pe
Website Personal: https://jorgemirez2002.wixsite.com/jorgemirez
Facebook http://www.facebook.com/jorgemirezperu
Linkedin https://www.linkedin.com/in/jorge-luis-mirez-tarrillo-94918423/
Scopus ID: https://www.scopus.com/authid/detail.uri?authorId=56488109800
Google Scholar: https://scholar.google.com/citations?user=_dSpp4YAAAAJ
MATLAB Group Admin in Facebook: https://www.facebook.com/groups/Matlab.Simulink.for.All
WhatsApp Channel/Canal: https://whatsapp.com/channel/0029VbCvpZsAYlUSz2esek2y

During operation a microgrid, sometimes; renewable energy sources and the external power grid, dispatched electric energy simultaneously. Sometimes, many sources is neccesary for supply to electric load. Also, all it, considering both economic and technical criteria. The figure represent la connection and disconnetion of sources for each state of performance of a microgrid. Too, it is applicable to other similar electric systems.
Dr. Jorge Luis Mírez Tarrillo
Group of Mathematical Modeling and Numerical Simulation (GMMNS).
Universidad Nacional de Ingeniería. Lima, Perú.
E-mail: jmirez@uni.edu.pe
Website Personal: https://jorgemirez2002.wixsite.com/jorgemirez
Facebook http://www.facebook.com/jorgemirezperu
Linkedin https://www.linkedin.com/in/jorge-luis-mirez-tarrillo-94918423/
Scopus ID: https://www.scopus.com/authid/detail.uri?authorId=56488109800
Google Scholar: https://scholar.google.com/citations?user=_dSpp4YAAAAJ
MATLAB Group Admin in Facebook: https://www.facebook.com/groups/Matlab.Simulink.for.All
WhatsApp Channel/Canal: https://whatsapp.com/channel/0029VbCvpZsAYlUSz2esek2y

Microgrids are both partand beneficiariesof the smart-grid concept. Is evident thatthere are objectives
shared between microgrids and the smart-grid concept: reduce the costs of energy and the reliability, efficiency and security improvement. Also, there are benefits which are linked to the useof smart-grid technologies: the deployment ofgreen technologies, different levels of quality and the use of demand response strategies
Source:
René B. Martínez-Cid. «Renewable-Driven Microgrids in Isolated Communities». A thesis submitted in partial fulfillment of the requirements for the degree of Master of Science in Electrical Engineering. University of Puerto Rico. Mayagüez Campus. 2009.
Dr. Jorge Luis Mírez Tarrillo
Group of Mathematical Modeling and Numerical Simulation (GMMNS).
Universidad Nacional de Ingeniería. Lima, Perú.
E-mail: jmirez@uni.edu.pe
Website Personal: https://jorgemirez2002.wixsite.com/jorgemirez
Facebook http://www.facebook.com/jorgemirezperu
Linkedin https://www.linkedin.com/in/jorge-luis-mirez-tarrillo-94918423/
Scopus ID: https://www.scopus.com/authid/detail.uri?authorId=56488109800
Google Scholar: https://scholar.google.com/citations?user=_dSpp4YAAAAJ
MATLAB Group Admin in Facebook: https://www.facebook.com/groups/Matlab.Simulink.for.All
WhatsApp Channel/Canal: https://whatsapp.com/channel/0029VbCvpZsAYlUSz2esek2y

One of the most promising applications of renewable energy technology is the installation of hybrid
energy systems (HES) in remote areas, where the grid extension is costly and the cost of fuel increases drastically with the remoteness of the location. Recent research have shown that HES have an excellent potential, as a form of supplementary contribution to conventional power generation systems. In figure, one of the most common hybrid renewable system implemented and studied is described.
Source:
Francisco Goncalves Goina Mesquita. «Design Optimization of Stand-Alone Hybrid Energy Systems». A Dissertation submitted under the scope of Mestrado Integrado em Engenharia Electrotécnica e de Computadores Major Energia. Fevereiro de 2010. Facultade de Engenharia da Universidade do Porto.
Dr. Jorge Luis Mírez Tarrillo
Group of Mathematical Modeling and Numerical Simulation (GMMNS).
Universidad Nacional de Ingeniería. Lima, Perú.
E-mail: jmirez@uni.edu.pe
Website Personal: https://jorgemirez2002.wixsite.com/jorgemirez
Facebook http://www.facebook.com/jorgemirezperu
Linkedin https://www.linkedin.com/in/jorge-luis-mirez-tarrillo-94918423/
Scopus ID: https://www.scopus.com/authid/detail.uri?authorId=56488109800
Google Scholar: https://scholar.google.com/citations?user=_dSpp4YAAAAJ
MATLAB Group Admin in Facebook: https://www.facebook.com/groups/Matlab.Simulink.for.All
WhatsApp Channel/Canal: https://whatsapp.com/channel/0029VbCvpZsAYlUSz2esek2y

The figure shows the minimum requirements for a VPP: a number of small participants (consumers or DERs); a communications network (the internet or dedicated lines); a communication platform with a common information model and a consensus on the communication architecture; a primary energy supply network; and a link to the energy market. The primary energy supply is the foundation of the VPP, the communication system forms the glue holding the VPP together, and the market link is the incentive which drives the system to service the needs of its owners and customers.A VPP may be dispersed over a large area, though in the case of islands and other microgrids it may equally well have tight geographical limits.
Source:
Riso Energy Report 8. “The intelligent energy system infraestructure for the future”. Riso National Laboratory. Technical University of Denmark. September 2009. ISBN 978-87-550-3754-0
Dr. Jorge Luis Mírez Tarrillo
Group of Mathematical Modeling and Numerical Simulation (GMMNS).
Universidad Nacional de Ingeniería. Lima, Perú.
E-mail: jmirez@uni.edu.pe
Website Personal: https://jorgemirez2002.wixsite.com/jorgemirez
Facebook http://www.facebook.com/jorgemirezperu
Linkedin https://www.linkedin.com/in/jorge-luis-mirez-tarrillo-94918423/
Scopus ID: https://www.scopus.com/authid/detail.uri?authorId=56488109800
Google Scholar: https://scholar.google.com/citations?user=_dSpp4YAAAAJ
MATLAB Group Admin in Facebook: https://www.facebook.com/groups/Matlab.Simulink.for.All
WhatsApp Channel/Canal: https://whatsapp.com/channel/0029VbCvpZsAYlUSz2esek2y

Denmark is the only net exporter of energy in the EU. In 2005, production from Danish oil and gas fields in the North sea exceeded the country’s gross energy consumption by 56%. At the same time Denmark has an environmentally-friendly energy profile that includes considerable amounts of renewable energy, especially wind power; strong energy efficiency measures; and widespread use of combined heat and power (CHP). For more than 20 years Denmark has kept its gross energy consumption almost constant, with an increase of just 4% since 1985, despite a 70% increase in gross national product in the same period. In short, Denmark is in a far better energy situation than most countries in the EU
Source:
Riso Energy Report 6. «Future options for energy technologies». Riso National Laboratory. Technical University of Denmark. November 2007. ISBN 978-87-550-3611-6
Dr. Jorge Luis Mírez Tarrillo
Group of Mathematical Modeling and Numerical Simulation (GMMNS).
Universidad Nacional de Ingeniería. Lima, Perú.
E-mail: jmirez@uni.edu.pe
Website Personal: https://jorgemirez2002.wixsite.com/jorgemirez
Facebook http://www.facebook.com/jorgemirezperu
Linkedin https://www.linkedin.com/in/jorge-luis-mirez-tarrillo-94918423/
Scopus ID: https://www.scopus.com/authid/detail.uri?authorId=56488109800
Google Scholar: https://scholar.google.com/citations?user=_dSpp4YAAAAJ
MATLAB Group Admin in Facebook: https://www.facebook.com/groups/Matlab.Simulink.for.All
WhatsApp Channel/Canal: https://whatsapp.com/channel/0029VbCvpZsAYlUSz2esek2y
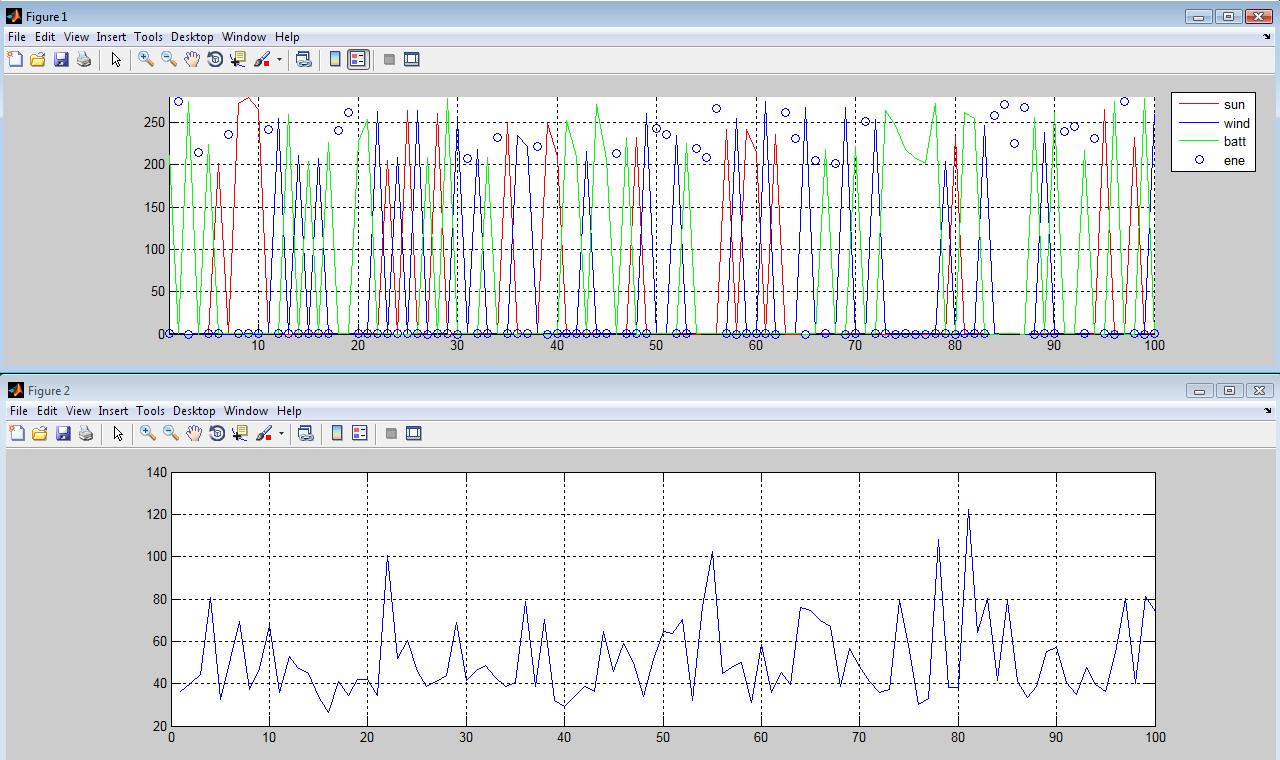
Usually the microgrid used wind turbine (wind), PV (sun), battery (batt) and load, aditional it have a PCC with electrical network external (ene). Both the technical operation as the economic operation are important during performance microgrid. In the figure I show the results of optimization process with imaginary energy prices from diferent source mentioned. In top figure is the power distribution between sources and down figure the total cost of each state. Programming linear has been used in this modelling and simulations.
Dr. Jorge Luis Mírez Tarrillo
Group of Mathematical Modeling and Numerical Simulation (GMMNS).
Universidad Nacional de Ingeniería. Lima, Perú.
E-mail: jmirez@uni.edu.pe
Website Personal: https://jorgemirez2002.wixsite.com/jorgemirez
Facebook http://www.facebook.com/jorgemirezperu
Linkedin https://www.linkedin.com/in/jorge-luis-mirez-tarrillo-94918423/
Scopus ID: https://www.scopus.com/authid/detail.uri?authorId=56488109800
Google Scholar: https://scholar.google.com/citations?user=_dSpp4YAAAAJ
MATLAB Group Admin in Facebook: https://www.facebook.com/groups/Matlab.Simulink.for.All
WhatsApp Channel/Canal: https://whatsapp.com/channel/0029VbCvpZsAYlUSz2esek2y
FACTS devices can enhance the power flow on existing power lines. For the transmission line shown in figure, the sending end voltage isVS∠δS, the receiving end voltage is VR∠δR and the equivalent impedance of parallel connected lines isX. The power transfer through the lines is given by:

the figure also shows how FACTS devices act on the power transfer equation. The TCSC can change the impedance of the line, the STATCOM can control the voltage magnitude at

the terminal to which it is connected by injecting or absorbing reactive power and the UPFC can alter the phase angle of the sending end voltage, thus power flow through a line can be controlled in a number of ways.
Source:
SMART GRID
TECHNOLOGY AND APPLICATIONS
Janaka Ekanayake
Cardiff University, UK
Kithsiri Liyanage
University of Peradeniya, Sri Lanka
Jianzhong Wu
Cardiff University, UK
Akihiko Yokoyama
University of Tokyo, Japan
Nick Jenkins
Cardiff University, UK
A John Wiley & Sons, Ltd., Publication
Dr. Jorge Luis Mírez Tarrillo
Group of Mathematical Modeling and Numerical Simulation (GMMNS).
Universidad Nacional de Ingeniería. Lima, Perú.
E-mail: jmirez@uni.edu.pe
Website Personal: https://jorgemirez2002.wixsite.com/jorgemirez
Facebook http://www.facebook.com/jorgemirezperu
Linkedin https://www.linkedin.com/in/jorge-luis-mirez-tarrillo-94918423/
Scopus ID: https://www.scopus.com/authid/detail.uri?authorId=56488109800
Google Scholar: https://scholar.google.com/citations?user=_dSpp4YAAAAJ
MATLAB Group Admin in Facebook: https://www.facebook.com/groups/Matlab.Simulink.for.All
WhatsApp Channel/Canal: https://whatsapp.com/channel/0029VbCvpZsAYlUSz2esek2y

Electricity meters are used to measure the quantity of electricity supplied to customers as well as to calculate energy and transportation charges for electricity retailers and network operators. The most common type of meter is an accumulation meter, which records energy consumption over time. Accumulation meters in consumer premises are read manually to assess how much energy has been used within a billing period. In recent years, industrial and commercial consumers with large loads have increasingly been using more advanced meters, for example, interval meters which record energy use over short intervals, typically every half hour. This allows the energy suppliers to design tariffs and charging structures that reflect wholesale prices and helps the customers understand and manage their pattern of electricity demand. Smart meters are even more sophisticated as they have two-way communications and provide a real-time display of energy use and pricing information, dynamic tariffs and facilitate the automatic control of electrical appliances
Source:
SMART GRID
TECHNOLOGY AND APPLICATIONS
Janaka Ekanayake
Cardiff University, UK
Kithsiri Liyanage
University of Peradeniya, Sri Lanka
Jianzhong Wu
Cardiff University, UK
Akihiko Yokoyama
University of Tokyo, Japan
Nick Jenkins
Cardiff University, UK
A John Wiley & Sons, Ltd., Publication
Dr. Jorge Luis Mírez Tarrillo
Group of Mathematical Modeling and Numerical Simulation (GMMNS).
Universidad Nacional de Ingeniería. Lima, Perú.
E-mail: jmirez@uni.edu.pe
Website Personal: https://jorgemirez2002.wixsite.com/jorgemirez
Facebook http://www.facebook.com/jorgemirezperu
Linkedin https://www.linkedin.com/in/jorge-luis-mirez-tarrillo-94918423/
Scopus ID: https://www.scopus.com/authid/detail.uri?authorId=56488109800
Google Scholar: https://scholar.google.com/citations?user=_dSpp4YAAAAJ
MATLAB Group Admin in Facebook: https://www.facebook.com/groups/Matlab.Simulink.for.All
WhatsApp Channel/Canal: https://whatsapp.com/channel/0029VbCvpZsAYlUSz2esek2y

The communication infrastructure of a power system typically consists of SCADA systems with dedicated communication channels to and from the System Control Centre and a Wide Area Network (WAN). Some long-established power utilities may have private telephone networks and other legacy communication systems. The SCADA systems connect all the major power system operational facilities, that is, the central generating stations, the transmission grid substations and the primary distribution substations to the System Control Centre. The WAN is used for corporate business and market operations. These form the core communication networks of the traditional power system. However, in the Smart Grid,it is expected that these two elements of communication infrastructure will merge into a Utility WAN.
An essential development of the Smart Grid (see figure ) is to extend communication throughout the distribution system and to establish two-way communications with customers through Neighbourhood Area Networks (NANs) covering the areas served by distribution substations. Customers’ premises will have Home Area Networks (HANs). The interface of the Home and Neighbourhood Area Networks will be through a smart meter or smart interfacing device.
Source:
SMART GRID
TECHNOLOGY AND APPLICATIONS
Janaka Ekanayake
Cardiff University, UK
Kithsiri Liyanage
University of Peradeniya, Sri Lanka
Jianzhong Wu
Cardiff University, UK
Akihiko Yokoyama
University of Tokyo, Japan
Nick Jenkins
Cardiff University, UK
A John Wiley & Sons, Ltd., Publication
Dr. Jorge Luis Mírez Tarrillo
Group of Mathematical Modeling and Numerical Simulation (GMMNS).
Universidad Nacional de Ingeniería. Lima, Perú.
E-mail: jmirez@uni.edu.pe
Website Personal: https://jorgemirez2002.wixsite.com/jorgemirez
Facebook http://www.facebook.com/jorgemirezperu
Linkedin https://www.linkedin.com/in/jorge-luis-mirez-tarrillo-94918423/
Scopus ID: https://www.scopus.com/authid/detail.uri?authorId=56488109800
Google Scholar: https://scholar.google.com/citations?user=_dSpp4YAAAAJ
MATLAB Group Admin in Facebook: https://www.facebook.com/groups/Matlab.Simulink.for.All
WhatsApp Channel/Canal: https://whatsapp.com/channel/0029VbCvpZsAYlUSz2esek2y

The figure shows the DMSC controller building blocks that assess operating conditions and find the control settings for devices connected to the network. The key functions of the DMSC are state estimation, bad data detection and the calculation of optimal control settings. The DMSC receives a limited number of real-time measurements at set intervals from the network nodes. The measurements are normally voltage, load injections and power flow measurements from the primary substation and other secondary substations. These measurements are used to calculate the network operating conditions. In addition to these real-time measurements, the DMSC uses load models to forecast load injections at each node on the network for a given period that coincides with the real-time measurements. The network topology and impedances are also supplied to the DMSC.
The state estimator uses this data to assess the network conditions in terms of node voltage magnitudes, line power flows and network injections. Bad measurements coming to the system will be filtered using bad data detection and identification methods.
Source:
SMART GRID
TECHNOLOGY AND APPLICATIONS
Janaka Ekanayake
Cardiff University, UK
Kithsiri Liyanage
University of Peradeniya, Sri Lanka
Jianzhong Wu
Cardiff University, UK
Akihiko Yokoyama
University of Tokyo, Japan
Nick Jenkins
Cardiff University, UK
A John Wiley & Sons, Ltd., Publication
Dr. Jorge Luis Mírez Tarrillo
Group of Mathematical Modeling and Numerical Simulation (GMMNS).
Universidad Nacional de Ingeniería. Lima, Perú.
E-mail: jmirez@uni.edu.pe
Website Personal: https://jorgemirez2002.wixsite.com/jorgemirez
Facebook http://www.facebook.com/jorgemirezperu
Linkedin https://www.linkedin.com/in/jorge-luis-mirez-tarrillo-94918423/
Scopus ID: https://www.scopus.com/authid/detail.uri?authorId=56488109800
Google Scholar: https://scholar.google.com/citations?user=_dSpp4YAAAAJ
MATLAB Group Admin in Facebook: https://www.facebook.com/groups/Matlab.Simulink.for.All
WhatsApp Channel/Canal: https://whatsapp.com/channel/0029VbCvpZsAYlUSz2esek2y

The Figure is a schematic of a simple distribution network with distributed generation (DG).There are many characteristics of this network that differ from a typical passive distribution network. First, the power flow is not unidirectional. The direction of power flows and the voltage magnitudes on the network depend on both the demand and the injected generation. Second, the distributed generators give rise to a wide range of fault currents and hence complex protection and coordination settings are required to protect the network. Third, the reactive power flow on the network can be independent of the active power flows. Fourth, many types of DGs are interfaced through power electronics and may inject harmonics into the network. The Figure also shows a control scheme suitable for achieving the functions of active control. In this scheme a Distribution Management System Controller (DMSC) assesses the network conditions and takes action to control the network voltages and flows. The DMSC obtains measurements from the network and sends signals to the devices under its control. Control actions may be a transformer tap operation, altering the DG output and injection/absorption
of reactive power.
Source:
SMART GRID
TECHNOLOGY AND APPLICATIONS
Janaka Ekanayake
Cardiff University, UK
Kithsiri Liyanage
University of Peradeniya, Sri Lanka
Jianzhong Wu
Cardiff University, UK
Akihiko Yokoyama
University of Tokyo, Japan
Nick Jenkins
Cardiff University, UK
A John Wiley & Sons, Ltd., Publication
Dr. Jorge Luis Mírez Tarrillo
Group of Mathematical Modeling and Numerical Simulation (GMMNS).
Universidad Nacional de Ingeniería. Lima, Perú.
E-mail: jmirez@uni.edu.pe
Website Personal: https://jorgemirez2002.wixsite.com/jorgemirez
Facebook http://www.facebook.com/jorgemirezperu
Linkedin https://www.linkedin.com/in/jorge-luis-mirez-tarrillo-94918423/
Scopus ID: https://www.scopus.com/authid/detail.uri?authorId=56488109800
Google Scholar: https://scholar.google.com/citations?user=_dSpp4YAAAAJ
MATLAB Group Admin in Facebook: https://www.facebook.com/groups/Matlab.Simulink.for.All
WhatsApp Channel/Canal: https://whatsapp.com/channel/0029VbCvpZsAYlUSz2esek2y

En esta entrada os presento un nuevo esquema ejemplo de la configuración de una microred eléctrica. Tiene constituido por carga eléctrica representado por un tablero de distribución, turbinas eólicas, una generador eléctrico, banco de baterías electrolíticas y una conexión a la red pública de electricidad. Usa el modo de distribución de corriente continua, por lo tanto, hay conversores y adecuadores de electricidad para que ésta pueda ser distribuida adecuadamente (soy un convencido que la corriente continua tiene mucho futuro). Igualmente hay un dispositivo de electrónica de potencia como Punto de Común Acoplamiento PCC hacia la red eléctrica externa. Muchas instalaciones no existen y por lo general, hay publicaciones y tesis que se encargan de hacer modelos y simulaciones para luego en un futuro próximo cercano estos se implementen como prototipos o ya productos en el mercado. Espero que os les sirva, añadiendo además que trabajo en la construcción de estos modelos matemáticos y computacionales en Matlab/Simulink.
PD: Las entradas para el siguiente año tendrán una versión en español catalogado como lo venimos haciendo por ejemplo J901, y otra en inglés que tendrá como inicio de nombre por ejemplo J901e. Attention: Next year, this blog have inputs in english with name for example J900e, «e» of post in english language.
The information related to this post for sale for US $ 1000.00. You can make payments through PayPal account: jorgemirez2002@gmail.com or send an e-mail to receive PayPal invoice and make your payment quickly and easily. Tell us (through e-mail) the name of the input or inputs that interests you. // La información relacionada con este post en venta por US $ 1000.00. Usted puede hacer pagos a través de cuenta PayPal: jorgemirez2002@gmail.com o enviar un e-mail para recibir la factura de PayPal y hacer su pago de forma rápida y sencilla. Díganos (por medio de email) el nombre de la entrada o entradas que le interese.
Dr. Jorge Luis Mírez Tarrillo
Group of Mathematical Modeling and Numerical Simulation (GMMNS).
Universidad Nacional de Ingeniería. Lima, Perú.
E-mail: jmirez@uni.edu.pe
Website Personal: https://jorgemirez2002.wixsite.com/jorgemirez
Facebook http://www.facebook.com/jorgemirezperu
Linkedin https://www.linkedin.com/in/jorge-luis-mirez-tarrillo-94918423/
Scopus ID: https://www.scopus.com/authid/detail.uri?authorId=56488109800
Google Scholar: https://scholar.google.com/citations?user=_dSpp4YAAAAJ
MATLAB Group Admin in Facebook: https://www.facebook.com/groups/Matlab.Simulink.for.All
WhatsApp Channel/Canal: https://whatsapp.com/channel/0029VbCvpZsAYlUSz2esek2y

Cualquier consumidor de energía eléctrica va a tener una potencia activa y reactiva que absolver y estas por lo general son proporcionales, debido a que el factor de potencia derivado del ajuste hecho por el banco de condensadores tratan de mantenerlo en proporción constante. Sin embargo, cuando se tiene una microred con fuentes propias o un usuario y a la vez conectado a la red eléctrica pública, pueda que en ciertos momentos haya un cierto flujo de potencia activa y/o reactiva hacia la red. Por lo general, es la reactiva, dado que las potencias de las fuentes se hacen siempre un poco menor a las necesidades y las condiciones ambientales también lo propician, además, hay regulación de en algunos países que no quieren que se inyecte a la red la potencia activa, pero de la reactiva no dicen nada, obvio, la inyección de potencia reactiva hacia la red pública de electricidad les ayuda a compensar el factor de potencia usando los bancos de condensadores de la microred. La simulación presentada en la figura ha sido hecha en Matlab de MathWork Inc. y sirve para visualizar como en momentos (se muestra valores absolutos) la potencia activa y/o reactiva toma diferentes direcciones (hacia o desde la red pública de electricidad). Espero os sirva.
The information related to this post for sale for US $ 20.00. You can make payments through PayPal account: jorgemirez2002@gmail.com or send an e-mail to receive PayPal invoice and make your payment quickly and easily. Tell us (through e-mail) the name of the input or inputs that interests you. // La información relacionada con este post en venta por US $ 20.00. Usted puede hacer pagos a través de cuenta PayPal: jorgemirez2002@gmail.com o enviar un e-mail para recibir la factura de PayPal y hacer su pago de forma rápida y sencilla. Díganos (por medio de email) el nombre de la entrada o entradas que le interese.
Dr. Jorge Luis Mírez Tarrillo
Group of Mathematical Modeling and Numerical Simulation (GMMNS).
Universidad Nacional de Ingeniería. Lima, Perú.
E-mail: jmirez@uni.edu.pe
Website Personal: https://jorgemirez2002.wixsite.com/jorgemirez
Facebook http://www.facebook.com/jorgemirezperu
Linkedin https://www.linkedin.com/in/jorge-luis-mirez-tarrillo-94918423/
Scopus ID: https://www.scopus.com/authid/detail.uri?authorId=56488109800
Google Scholar: https://scholar.google.com/citations?user=_dSpp4YAAAAJ
MATLAB Group Admin in Facebook: https://www.facebook.com/groups/Matlab.Simulink.for.All
WhatsApp Channel/Canal: https://whatsapp.com/channel/0029VbCvpZsAYlUSz2esek2y

Cuando el comportamiento es aleatorio, lo usual es pensar que quizás pasado un determinado período de tiempo, dicho comportamiento tienda hacia un comportamiento claro y definido. La figura es una simulación de una consumidor de curva de demanda aleatoria uniformemente distribuido por un día. Quizás al final del día no se vea claro una tendencia, pero se perfila un comportamiento predecible, por lo tanto, dicha consumo no será analizado solo por los valores de consumo, sino por las tendencias de la misma. Surge entonces proponer nuevas variables y un manejo de conceptos de estadística bastante interesantes, quizás por momentos alejado de lo recomendado por la Norma Técnica o cualquier libro. Pero oh! los eruditos en normas técnicas tendrán que previamente repasar sus conceptos o quizás cegarse en decir que se cumpla la norma, cada país tiene su desarrollo industrial y aquellos con mayor desarrollo, tienen una normativa más actualizada, basta con mirar este detalle para saber de que pata cojeas compadre o compatriota. En fin, hecho en Matlab de MathWorks la figura es complemento del anterior post que espero os sirva para esos casos en que tienen datos de consumo (y que a veces escasean) o deseas asumir consumos dentro de las capacidades de la planta y en vez de colocar un factor de planta o factor de simultaneidad para todas las 24 horas 7 días de la semana y del mes, puedes analizar mejor por cada hora a fin de optimizar el recurso eléctrico más aún si ésta proviene de una fuente de generación local como es el caso de una microred.
The information related to this post for sale for US $ 250.00. You can make payments through PayPal account: jorgemirez2002@gmail.com or send an e-mail to receive PayPal invoice and make your payment quickly and easily. Tell us (through e-mail) the name of the input or inputs that interests you. // La información relacionada con este post en venta por US $ 250.00. Usted puede hacer pagos a través de cuenta PayPal: jorgemirez2002@gmail.com o enviar un e-mail para recibir la factura de PayPal y hacer su pago de forma rápida y sencilla. Díganos (por medio de email) el nombre de la entrada o entradas que le interese.
Dr. Jorge Luis Mírez Tarrillo
Group of Mathematical Modeling and Numerical Simulation (GMMNS).
Universidad Nacional de Ingeniería. Lima, Perú.
E-mail: jmirez@uni.edu.pe
Website Personal: https://jorgemirez2002.wixsite.com/jorgemirez
Facebook http://www.facebook.com/jorgemirezperu
Linkedin https://www.linkedin.com/in/jorge-luis-mirez-tarrillo-94918423/
Scopus ID: https://www.scopus.com/authid/detail.uri?authorId=56488109800
Google Scholar: https://scholar.google.com/citations?user=_dSpp4YAAAAJ
MATLAB Group Admin in Facebook: https://www.facebook.com/groups/Matlab.Simulink.for.All
WhatsApp Channel/Canal: https://whatsapp.com/channel/0029VbCvpZsAYlUSz2esek2y


The information related to this post for sale for US $ 100.00. You can make payments through PayPal account: jorgemirez2002@gmail.com or send an e-mail to receive PayPal invoice and make your payment quickly and easily. Tell us (through e-mail) the name of the input or inputs that interests you. // La información relacionada con este post en venta por US $ 100.00. Usted puede hacer pagos a través de cuenta PayPal: jorgemirez2002@gmail.com o enviar un e-mail para recibir la factura de PayPal y hacer su pago de forma rápida y sencilla. Díganos (por medio de email) el nombre de la entrada o entradas que le interese.
Dr. Jorge Luis Mírez Tarrillo
Group of Mathematical Modeling and Numerical Simulation (GMMNS).
Universidad Nacional de Ingeniería. Lima, Perú.
E-mail: jmirez@uni.edu.pe
Website Personal: https://jorgemirez2002.wixsite.com/jorgemirez
Facebook http://www.facebook.com/jorgemirezperu
Linkedin https://www.linkedin.com/in/jorge-luis-mirez-tarrillo-94918423/
Scopus ID: https://www.scopus.com/authid/detail.uri?authorId=56488109800
Google Scholar: https://scholar.google.com/citations?user=_dSpp4YAAAAJ
MATLAB Group Admin in Facebook: https://www.facebook.com/groups/Matlab.Simulink.for.All
WhatsApp Channel/Canal: https://whatsapp.com/channel/0029VbCvpZsAYlUSz2esek2y


Atiendo a esta reunión bastante importante es que gracias al apoyo de CYTED y CEDER-CIEMAT es que daremos esta conferencia en el marco del IIi Congreso Iberoamericano de Microredes con Generación Distribuida de Renovables. Este evento sirve de marco para el intercambio de información, experiencias y el tomar en contacto con investigadores provenientes de diferentes países de habla hispana y no hispana, dedicados al sector energía y otros sectores incluyendo el aeroespacial en que el uso de fuentes de energía como sol, viento, biomasa, celdas de combustible, entre otras es bastante importante. Y no sólo eso, importante y quizás mucho más lo que es las técnicas de control, predicción, modelamiento y simulación, software desarrollado que son las cosas de mayor valor agregado, la combinación de diferentes escenarios de trabajo y de implementación en industrias, centros de atención de salud, barcos, naves espaciales, soporte de vida en condiciones extremas, etc. Les dejo la portada de mi presentación y cualquier comunicación a jorgemirez2002@gmail.com, y quienes estén por acá, estaremos conversando.
The information related to this post for sale for US $ 100.00. You can make payments through PayPal account: jorgemirez2002@gmail.com or send an e-mail to receive PayPal invoice and make your payment quickly and easily. Tell us (through e-mail) the name of the input or inputs that interests you. // La información relacionada con este post en venta por US $ 100.00. Usted puede hacer pagos a través de cuenta PayPal: jorgemirez2002@gmail.com o enviar un e-mail para recibir la factura de PayPal y hacer su pago de forma rápida y sencilla. Díganos (por medio de email) el nombre de la entrada o entradas que le interese.
Dr. Jorge Luis Mírez Tarrillo
Group of Mathematical Modeling and Numerical Simulation (GMMNS).
Universidad Nacional de Ingeniería. Lima, Perú.
E-mail: jmirez@uni.edu.pe
Website Personal: https://jorgemirez2002.wixsite.com/jorgemirez
Facebook http://www.facebook.com/jorgemirezperu
Linkedin https://www.linkedin.com/in/jorge-luis-mirez-tarrillo-94918423/
Scopus ID: https://www.scopus.com/authid/detail.uri?authorId=56488109800
Google Scholar: https://scholar.google.com/citations?user=_dSpp4YAAAAJ
MATLAB Group Admin in Facebook: https://www.facebook.com/groups/Matlab.Simulink.for.All
WhatsApp Channel/Canal: https://whatsapp.com/channel/0029VbCvpZsAYlUSz2esek2y
Blog in ENGLISH

Compra/Buy – Haz una donación/Make a donation

Dear reader, if you wish to make a donation or are interested in any information or code, please contact me (e-mail: jmirez@uni.edu.pe). Donations will allow you to continue studying and researching, and also to provide more information on this blog. My PayPal account is jorgemirez2002@gmail.com or if it is by bank transfer write to my email jmirez@uni.edu.pe. Any amount of money is welcome. Thank you.
Estimado lector, si desean hacer una donación o le interesa alguna información o código, favor ponerse en contacto con mi persona (e-mail: jmirez@uni.edu.pe). Las donaciones va a permitir seguir estudiando e investigando, y además, el poder brindar más información en este blog. Mi cuenta en PayPal es jorgemirez2002@gmail.com o si es por transferencia bancaria escribirme a mi correo jmirez@uni.edu.pe. Cualquier cantidad de dinero es bienvenido. Gracias.
Datos Generales
Good day. My full name is Jorge Luis MIREZ TARRILLO.
I am Peruvian and live in Lima, capital of Perú in South America.I am Mechanical Electrical Engineering, MSc Physics and Dr. Physics (title doctoral thesis: Control, Optimization, and Management of Microgrid Current Direct)
Too, actually job as Principal Professor in Faculty of Oil, Gas and Petrochemical Engineering of Universidad Nacional de Ingeniería (National University of Engineering) in Lima – PERU (Courses: Modern Physics, Differential Equations and Research's Methodology)
My subjects of my interest are control, signal processing, optimization, simulation, biomedical research, smart grid, microgrid, water.
I have experience in Matlab/Simulink programming, biomedical equipment, electrical systems, renewable energies, microgrids, saturated steam systems 100 psi and organizing academic events.

Comentarios Recientes
Elementos que compon… en J506: Los elementos de un paqu… Dr. Jorge Mírez en Message by IEEE Community Dr. Jorge Mírez en J546: Simulación de campos mag… jose luis huayanay v… en Message by IEEE Community Cesar Aviles en J546: Simulación de campos mag… Dr. Jorge Mírez en J518: La herramienta pdetool d… Dr. Jorge Mírez en J496: Simulación en Matlab/Sim… Raúl Barrios Elizarr… en J496: Simulación en Matlab/Sim… jose luis huayanay v… en J518: La herramienta pdetool d… MSc. Jorge Mírez en J281: La Rosa de Vientos: Frec…


Debe estar conectado para enviar un comentario.